


Eight Section Split Diagram
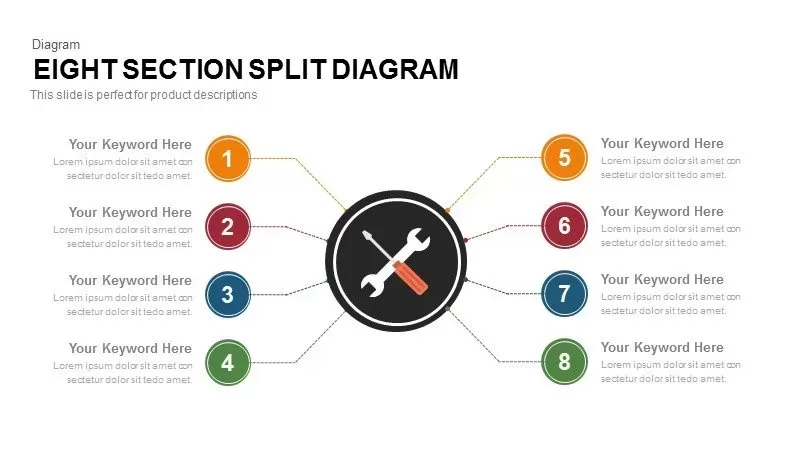
Elevate your strategic overviews and project dashboards with this dynamic eight-section split diagram slide. A central circular hub houses a customizable icon, from which eight dashed lines extend symmetrically to numbered circles that act as callouts. Each numbered circle features a vibrant color fill—ranging from golden yellow and crimson red to sky blue, emerald green, and jewel tones—paired with concise headline and descriptive text placeholders. Dashed connectors guide the viewer’s eye, creating a balanced radial layout that seamlessly accommodates both high-level summaries and detailed annotations. The clean white backdrop and minimalist sans-serif typography maintain a modern aesthetic, ensuring that your core message and each segment remain crystal clear.
Built on fully editable vector shapes and master slides, this layout offers complete customization in PowerPoint and Google Slides. Easily swap the central icon to represent different concepts, adjust connector styles, or recolor numbered circles to match brand guidelines. Text placeholders allow for quick updates of section titles, keywords, and supporting details, while grid and alignment guides ensure consistent positioning. Whether you need to illustrate departmental responsibilities, feature breakdowns, or multi-faceted analytics, this slide adapts effortlessly to varied content needs, making it a versatile addition to any professional toolkit.
Optimized for collaborative workflows, the slide supports real-time co-authoring and maintains pixel-perfect clarity across devices. Use this eight-callout hub-and-spoke diagram to streamline stakeholder presentations, product roadmaps, or executive briefings. By combining high-impact visuals with intuitive structure, you can guide audiences through complex information with precision and impact. The radial symmetry and distinct color cues enhance information recall and facilitate audience engagement.
Who is it for
Marketing managers, project leads, and business analysts will leverage this eight-section split diagram to illustrate multi-faceted workflows, feature breakdowns, and strategic roadmaps. Consultants, trainers, and cross-functional teams can employ its radial layout during stakeholder briefings, workshops, and executive presentations to ensure clear, aligned communication.
Other Uses
Repurpose this slide for customer journey mapping, risk assessment frameworks, or departmental KPIs. Swap icons and adjust colors to adapt the layout for product feature comparisons, budget allocations, or organizational charts—making it a versatile visual asset across industries and functions.
Login to download this file

Item ID
SB00336