Creative Lab Beakers


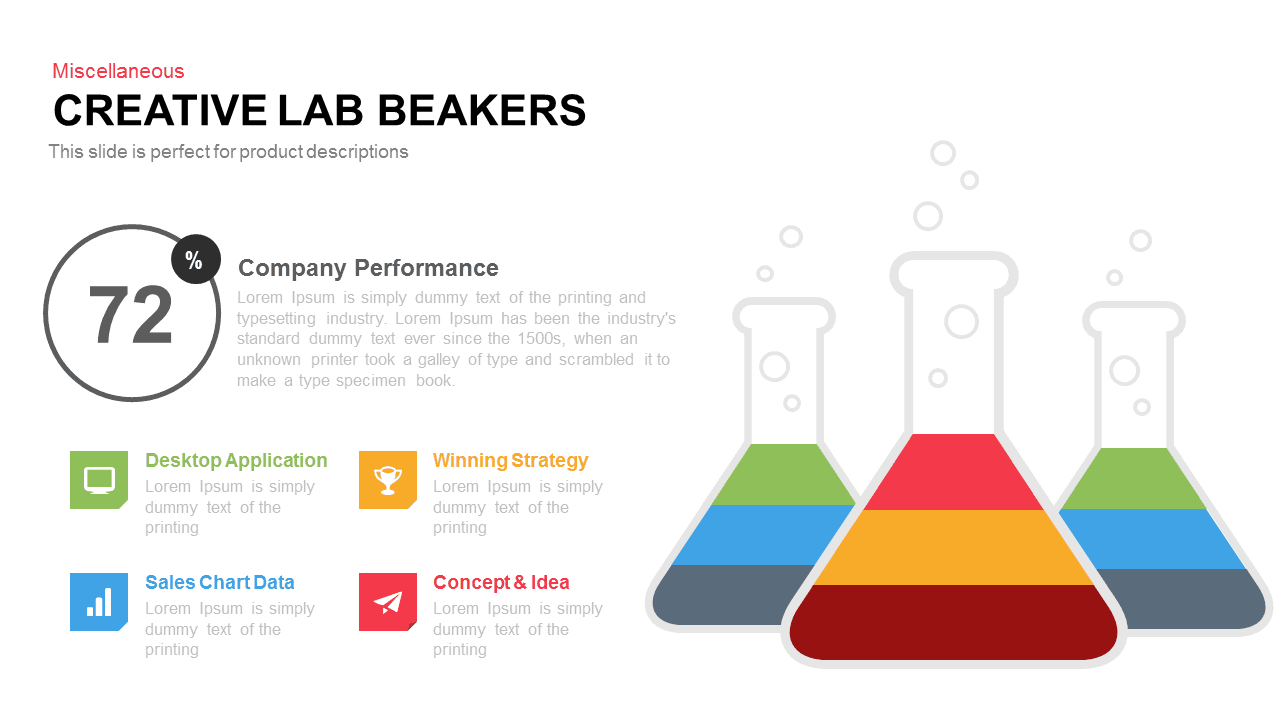
Showcase segmented data with this creative lab beakers infographic slide, designed to depict multiple data layers within stylized beaker icons. Three laboratory flasks of varying sizes sit against a clean white backdrop, each half-filled with color-coded liquid layers—deep charcoal base, vibrant blue, fresh green, bright yellow, and bold red—mapping directly to four key metrics. A prominent circular gauge on the left displays an editable percentage value, accompanied by a headline for company performance and supporting text. Beneath, four icon-based callouts—Desktop Application, Winning Strategy, Sales Chart Data, and Concept & Idea—use matching color accents to tie narrative points to each beaker segment. Crisp outlines, subtle drop shadows, and minimalist sans-serif typography ensure legibility and modern appeal.
This fully customizable slide is built on master shapes and vector graphics, enabling quick edits to beaker sizes, liquid layer proportions, and color schemes. Swap icons, update labels, or reposition elements with ease in PowerPoint or Google Slides. The design maintains pixel-perfect clarity across screens, facilitating seamless collaboration and version control. Ideal for presenting multi-variable data sets, this infographic brings scientific flair to business contexts, whether you’re reviewing quarterly KPIs, illustrating resource allocation, or mapping process efficiencies. The layered beaker metaphor aids in breaking down complex information into digestible visual segments, promoting audience engagement and retention.
Who is it for
Marketing managers, business analysts, and operations teams will leverage this creative beaker infographic when presenting performance metrics, resource distributions, or process breakdowns. Consultants, educators, and training facilitators can use the slide to illustrate experimental results, workshop modules, or research findings with clear, visual segmentation.
Other Uses
Repurpose this template for project milestone timelines, department output comparisons, or educational infographics. Adjust beaker counts and color schemes to map budget allocations, feature prioritizations, or step-by-step procedures. With its scientific motif and data-driven layout, the slide is versatile for strategic reviews, client proposals, and academic presentations.
Login to download this file
Add to favorites
Add to collection


