


4 Arrows Pointing Business Process
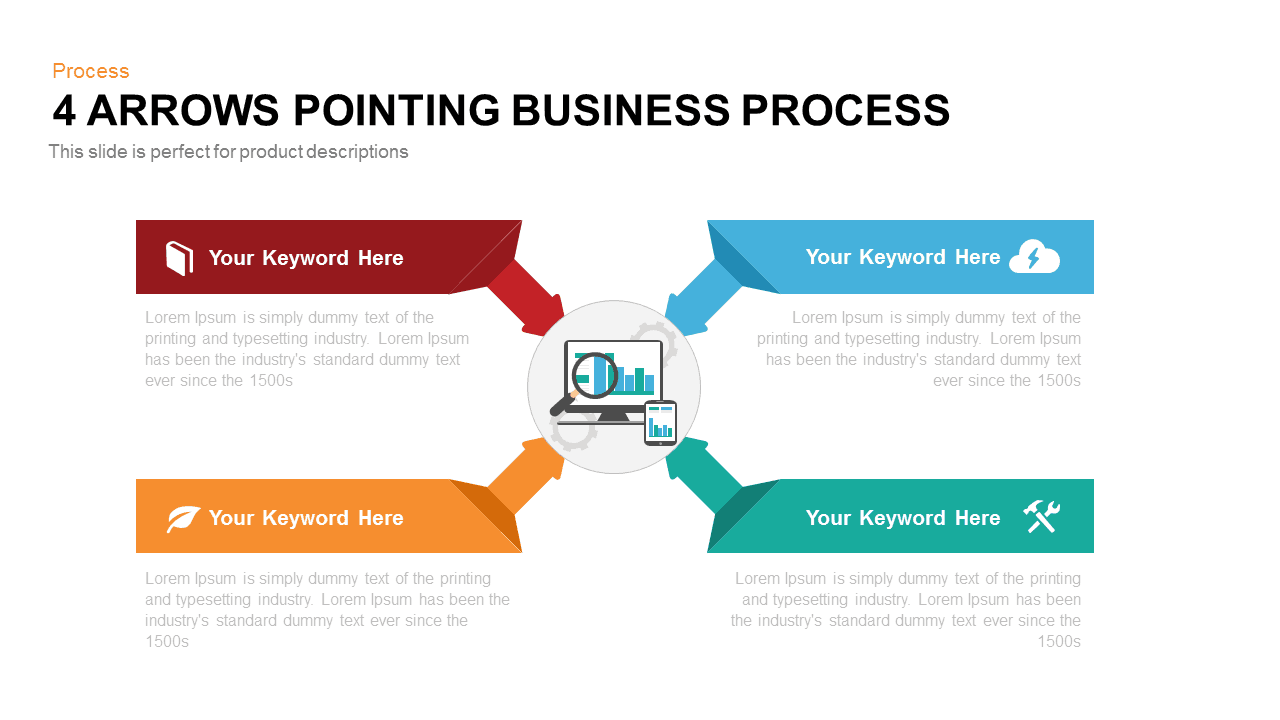
Elevate your business presentations with this four-arrow process diagram slide, designed to visualize workflows, stages, or key initiatives with clarity and impact. Four bold arrows—in red, sky blue, aqua green, and orange—point inward toward a central circular hub featuring a customizable data and analytics icon. Each arrow banner includes a headline placeholder and corresponding text block, allowing you to label process phases, objectives, or action items. Beneath each arrow, ample space is provided for detailed descriptions, ensuring you can elaborate on core messages without overwhelming your audience.
Prebuilt with editable master shapes, this asset offers seamless customization: adjust arrow colors, swap icons, and modify text placeholders to align with your brand identity. The minimalist white background and clean typography maintain focus on your content, while subtle shadow effects impart depth and dimension. Designed for both PowerPoint and Google Slides, the slide preserves crisp clarity across devices and supports collaborative editing, streamlining team contributions and version control.
Ideal for illustrating business workflows, project phase breakdowns, strategic roadmaps, and stakeholder alignment sessions, this process diagram enhances meeting agendas, training modules, and executive briefings. The intuitive layout guides viewers through sequential steps, facilitating data-driven discussions and decision-making.
Beyond process mapping, this versatile diagram can be repurposed for risk assessments, service funnels, resource allocation tiers, or performance reviews. Simply duplicate arrows to expand stages, adjust hues to reflect priority levels, and update icons to match context. Whether you are presenting marketing campaigns, operational plans, or cross-functional projects, this four-arrow diagram empowers you to communicate complex ideas with precision and style.
Who is it for
Marketing teams, product managers, and project leads will find this four-arrow process diagram invaluable for illustrating workflows, roadmaps, and phase breakdowns. Consultants, business analysts, and training facilitators can leverage its intuitive design to guide audiences through sequential steps and ensure stakeholder alignment.
Other Uses
Repurpose this slide for risk severity scales, service funnel visualizations, resource allocation breakdowns, or performance review frameworks. By swapping arrow colors and icons, you can adapt the template for compliance workflows, operational checklists, or executive dashboards across industries and functions.
Login to download this file

Item ID
SB00317