


Louisiana Parish Map PowerPoint Template
Description
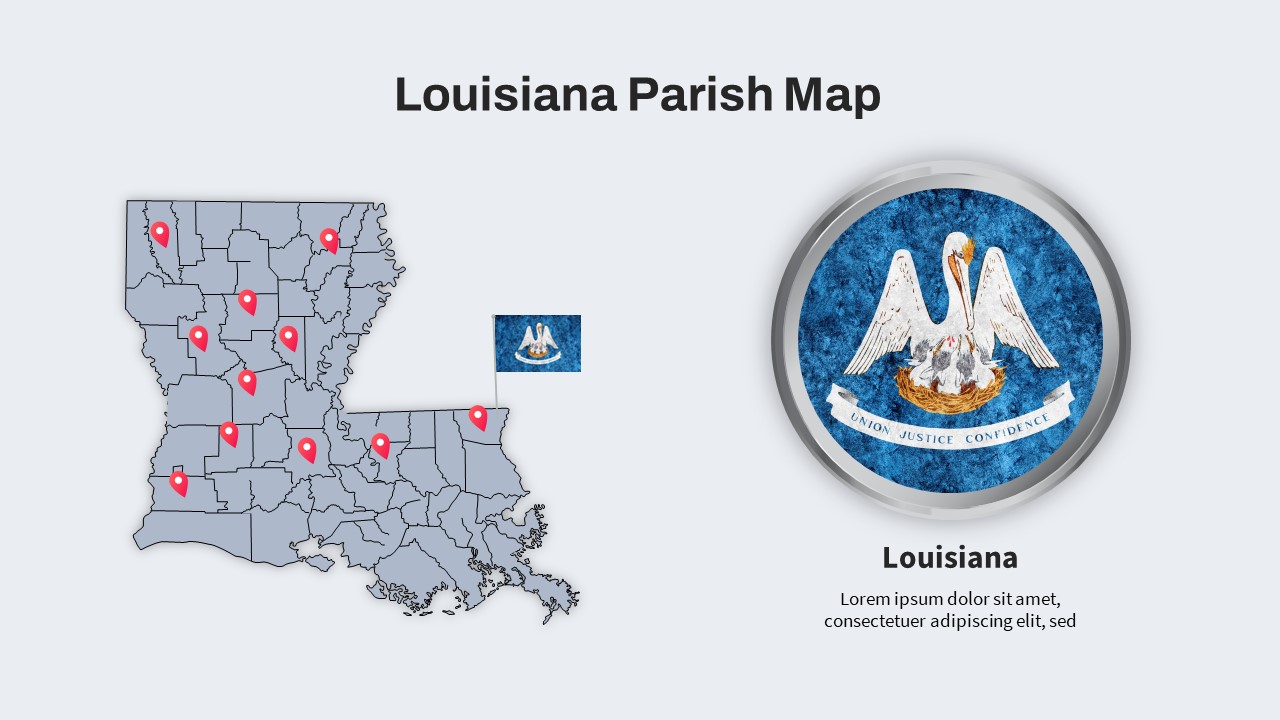
Leverage this Louisiana parish map slide to present geographic data, regional distribution, and location-specific insights with clarity and impact. This fully editable vector map outlines all parishes, accompanied by customizable pin markers for highlighting key locations such as offices, facilities, or target markets. On the right, a circular placeholder for the Louisiana state emblem or flag offers a prominent focal point, framed by subtle shadows and beveled edges to create depth and visual contrast against the clean background. The map elements are designed for easy color adjustments, enabling you to match corporate branding or thematic palettes without compromising quality or resolution.
Engineered for seamless workflow, this slide makes use of master layouts, vector shapes, and intuitive placeholders, allowing you to reposition markers, update text labels, or swap icons in seconds. The minimal design aesthetic—featuring consistent line weights and a neutral backdrop—ensures that your data remains front and center, while the balanced composition supports clear storytelling. Whether you are highlighting market penetration, distribution networks, or regional performance metrics, this template adapts to a variety of use cases and industry contexts.
Optimized for both PowerPoint and Google Slides, the slide maintains full resolution clarity across devices, eliminating scaling issues and preserving visual fidelity during presentations. The vector-based map ensures crisp, pixel-free graphics, and the subtle drop shadows beneath markers enhance readability on both screens and printed materials. Use this asset to drive stakeholder alignment, facilitate geographic analyses, or reinforce regional strategies with a professional and polished look. With its combination of functionality and aesthetic appeal, this Louisiana parish map slide streamlines your workflow and elevates your presentation’s impact.
Who is it for
Regional planners, sales managers, and market analysts will benefit from this map slide when illustrating parish-level data, distribution channels, or location-based performance. Government agencies, educational institutions, and consulting firms can also leverage this layout for demographic studies, resource planning, or field operations reviews.
Other Uses
Beyond parish maps, repurpose this slide to visualize office networks, supply chain routes, or service coverage areas for any state or region. Swap the circular emblem for logos or KPI icons to create location dashboards, event site layouts, or fundraising territory breakdowns across industries.
Login to download this file
Add to favorites
Add to collection

Item ID
SB04208