


Bubble Chart PowerPoint Templates

Description
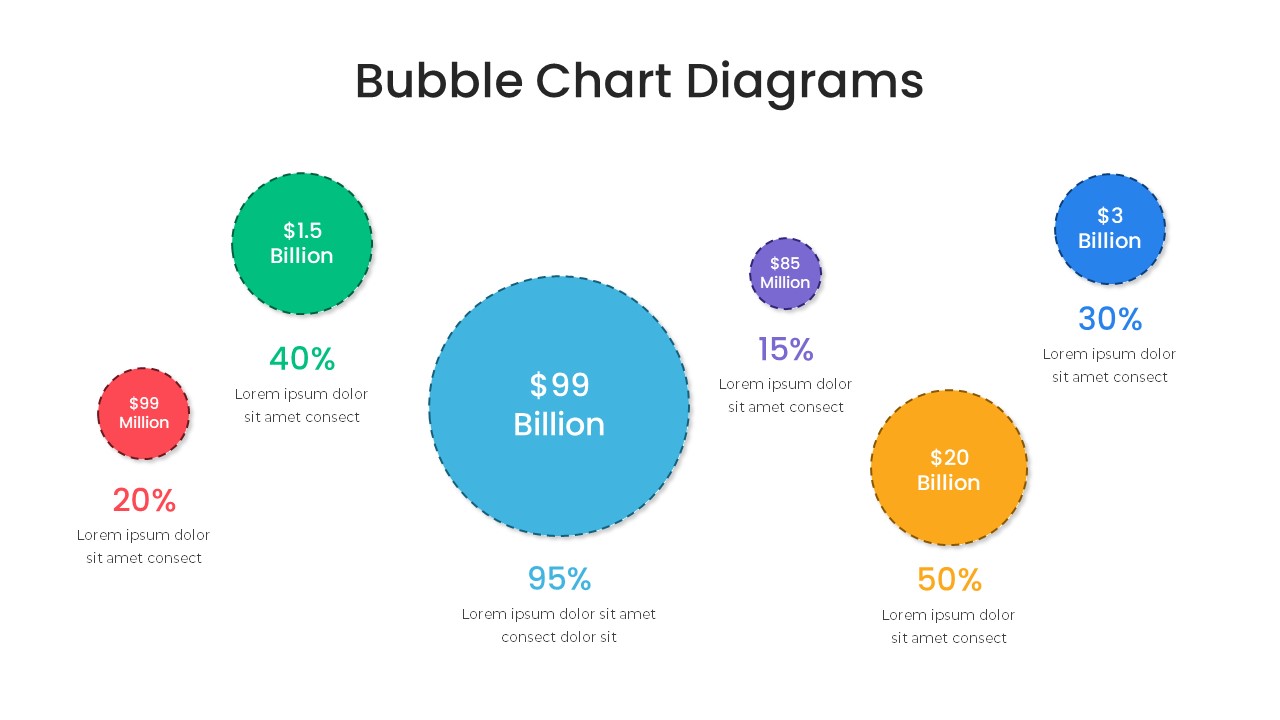
Leverage this comprehensive bubble chart pack to visualize multi-dimensional data with clarity and impact across three distinct layouts. The scatter bubble chart slide plots value points along horizontal and vertical axes, using size-variable circles to represent magnitude. The bubble chart diagram slide arranges data points in a horizontal sequence, pairing bold percentage labels with customizable captions and dashed-outline bubbles for an engaging infographic style. The bubble chart matrix slide maps products into four quadrants—combining relative market share and growth potential—and includes a clean legend for quick reference. Each layout is available in both light and dark themes, features editable vector shapes, master-slide formatting, and color presets to match your brand palette.
Engineered for flexibility, these slides support rapid updates: swap data, adjust bubble sizes, relocate labels, or toggle guide lines in seconds. The clean white and noir backgrounds ensure readability in boardroom presentations, webinars, or printed reports. Whether you’re illustrating performance comparisons, market positioning, or resource allocation, this pack streamlines your workflow by maintaining consistent styling and layout integrity across PowerPoint and Google Slides platforms.
Beyond core business metrics, repurpose these bubble chart templates for customer segmentation analysis, risk-reward assessments, product portfolio reviews, or scientific data presentations. Duplicate or hide elements to create custom dashboards, ROI projections, or educational visuals. This versatile asset elevates any data-driven narrative, fostering insight-led discussions and accelerating decision-making.
Who is it for
Business analysts, marketing strategists, and product managers will benefit from these bubble chart slides when presenting comparative metrics, market analysis, or portfolio evaluations. Consultants and educators can leverage the pack to deliver clear, data-rich storytelling.
Other Uses
Repurpose these layouts for performance dashboards, competitive benchmarking, budget allocations, investment risk matrices, or academic research summaries—simply update labels, adjust axes, and customize bubble sizes to suit your objectives.
Login to download this file

Item ID
SB04165