


Marginal Costing PowerPoint Template featured image
Description
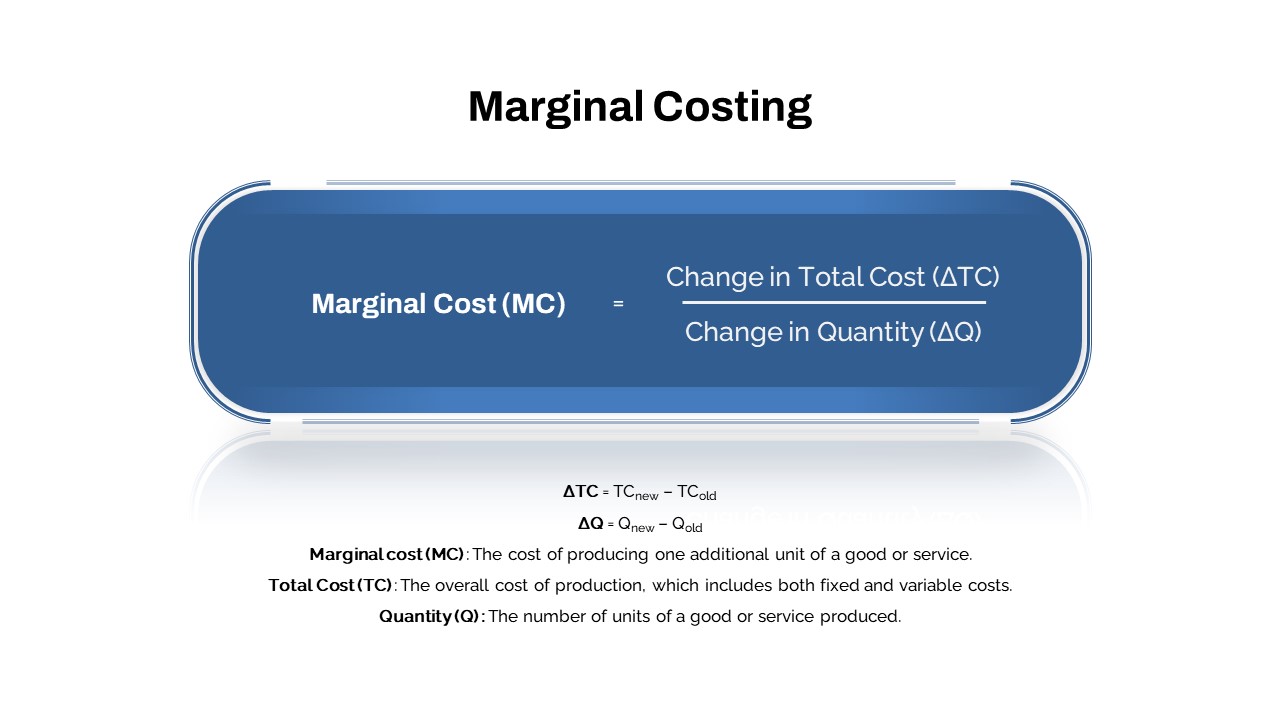
Drive deeper audience understanding of incremental cost analysis with this professionally designed Marginal Costing slide. The centerpiece features a sleek rounded capsule graphic in rich blue, framing the key equation: Marginal Cost (MC) = Change in Total Cost (ΔTC) ÷ Change in Quantity (ΔQ). Displayed as a horizontal fraction, the numerator and denominator are clearly separated by a crisp white dividing line, ensuring instant readability. Below this focal element, concise text definitions break down each component—ΔTC, ΔQ, MC, TC, and Q—so viewers can reference exact meanings without consulting external notes. A subtle reflection and soft drop shadow impart a modern 3D effect that enhances visual appeal without overshadowing content.
Designed for seamless integration, this template supports both PowerPoint and Google Slides environments at full resolution, maintaining flawless alignment across devices. All text placeholders, icons, and shapes are vector-based and fully editable, enabling quick customization of colors, fonts, and labels to match corporate branding or academic themes. The clean white background promotes focus, while the high-contrast blue accent guides the eye to the formula. Use this slide to illustrate cost behavior in microeconomics lectures, financial modeling sessions, or operational efficiency workshops.
Whether you’re leading a class, pitching a budget proposal, or conducting an internal training, this slide simplifies complex cost concepts into an easily digestible visual. Its structured layout fosters step-by-step walkthroughs of cost variance scenarios, making it ideal for scenario planning, ROI analysis, or production optimization discussions. Duplicate or rearrange sections to compare multiple production batches or extend definitions with additional notes. With this adaptable asset in your toolkit, you can present marginal costing clearly, engage stakeholders, and support data-driven decision making in any commercial or educational context.
Who is it for
Economics instructors, financial analysts, cost accountants, and operations managers will find this slide invaluable when explaining incremental cost principles or conducting cost–volume–profit (CVP) analysis. Business consultants, MBA students, and production planners can leverage this clear visual to support budget proposals, pricing strategies, or efficiency workshops.
Other Uses
Repurpose this slide for ROI calculations, break-even analyses, product pricing discussions, or scenario planning exercises. It can also support project cost evaluations, manufacturing optimization presentations, budget variance reports, or training modules on cost management. With custom labeling, use the formula graphic to compare alternative cost structures or to illustrate stepwise cost changes across production runs.
Login to download this file

Item ID
SB04255