


Root Cause Analysis Fault Tree PPT Template

Description
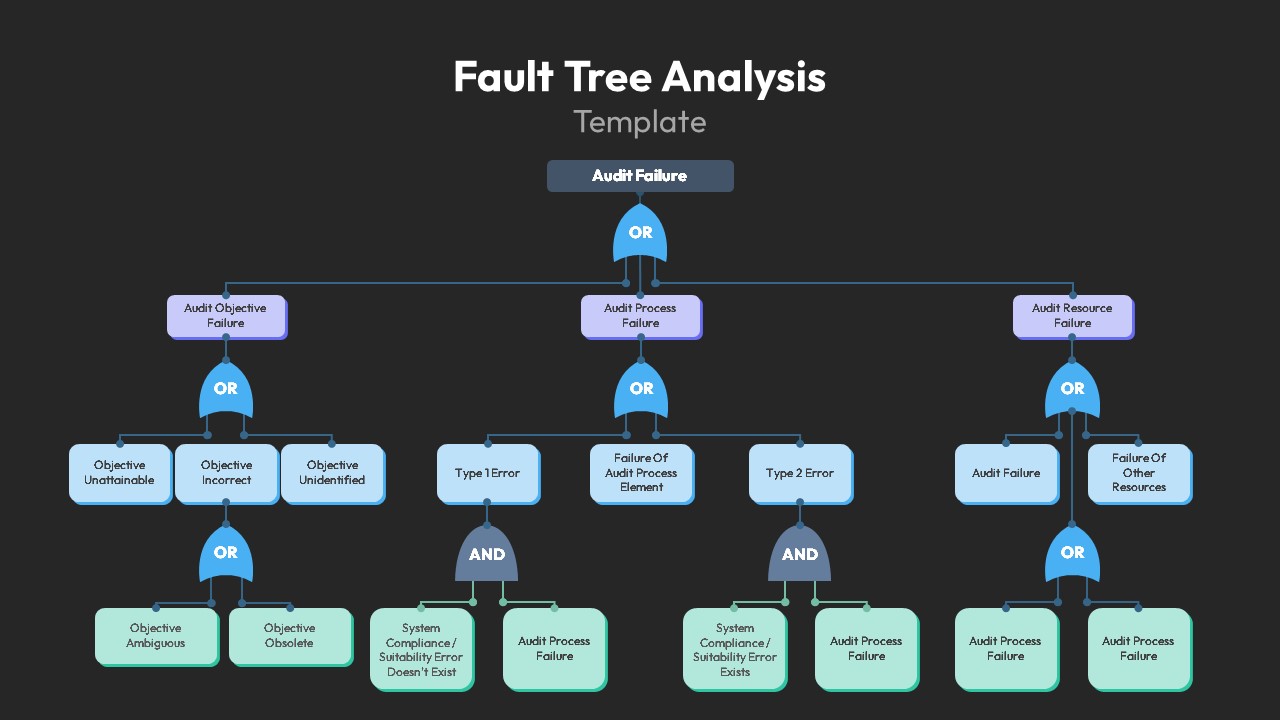
Leverage this comprehensive 17-slide root cause analysis infographic pack to diagnose, visualize, and resolve underlying issues with clarity and impact. The pack opens with a sleek title slide, then delivers nine dedicated analysis frameworks—5 Whys, causal factor tree, fishbone (Ishikawa), event tree, fault tree, change analysis, barrier analysis, FMEA, and Kepner-Tregoe problem analysis—each rendered in modern gradient color schemes and crisp vector shapes. Sequential arrow flows, branching nodes, and tabular layouts guide audiences step by step through problem identification, causal exploration, risk assessment, and corrective-action planning.
All slides are built on editable master layouts so you can swap titles, adjust step counts, recolor gradients, or replace icons in seconds without breaking alignment. Auto-guide markers and grouping ensure consistent spacing when resizing or repositioning elements, while preset entrance animations let you reveal each layer of analysis in controlled sequence for maximum storytelling impact. High-resolution vectors maintain full clarity on large-format screens, and the templates export flawlessly from PowerPoint to Google Slides, eliminating version-control headaches.
Whether you’re facilitating quality-control workshops, driving Lean Six Sigma initiatives, or training teams on systematic problem solving, this infographic pack equips you with versatile frameworks that streamline root cause investigations and foster data-driven decision making.
Who is it for
Quality managers, process engineers, and operational excellence teams will benefit from these slides when conducting defect investigations, audits, or continuous-improvement projects. Consultants, project managers, and trainers can also leverage the templates to teach problem-solving methodologies and lead stakeholder workshops.
Other Uses
Repurpose the layouts for incident analyses, risk-assessment briefings, compliance reviews, or service-delivery mappings. Use the modular designs to map decision trees, failure scenarios, or contingency plans in manufacturing, healthcare, IT, or service industries.
Login to download this file

Item ID
SB02440