


Wheel-Chart-PPT-Templates

Description
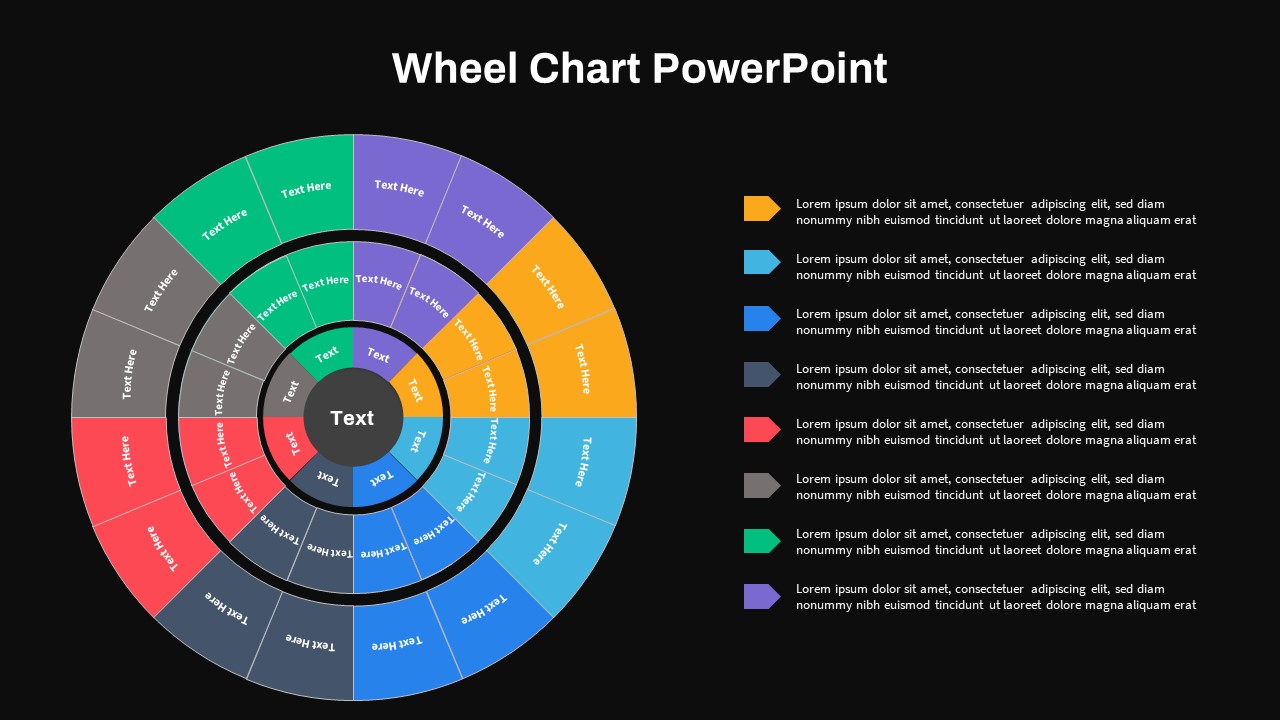
Unlock the power of layered visual storytelling with this multi-level wheel chart diagram slide, designed to present complex processes, hierarchical relationships, and segmented data with clarity and style. The slide features three concentric rings divided into color-coded segments, each equipped with editable text placeholders and subtle dividing lines. On the right, a clean legend with four arrow-shaped callouts aligns segment hues to descriptive text blocks, enhancing readability and ensuring audiences can quickly match visual elements to key points. This dynamic layout leverages master slide functionality, enabling you to adjust segment counts, update color schemes, or replace placeholder text in seconds without breaking slide formatting. Crisp typography, balanced whitespace, and a neutral white background keep focus on your content, while the vibrant color palette adds visual interest without overwhelming the viewer. Whether you need to illustrate product portfolios, regional performance metrics, organizational units, or multi-stage workflows, this wheel chart adapts seamlessly to your narrative. Built for both PowerPoint and Google Slides, the slide preserves full resolution and retains precise alignment across platforms, eliminating compatibility headaches. Simply drag and drop elements, tweak labels, or swap palette colors to reflect your brand identity in one click. Compatible with corporate presentations, startup pitch decks, or academic slides, this asset accelerates your design process and elevates audience engagement. Use animation effects to rotate rings or fade in segments during your presentation, or print static handouts with high-quality graphics. Each segment placeholder supports rich text formatting, icons, and data labels, offering maximum flexibility for KPI reporting or competitive analysis. Leverage color gradients or corporate color themes to maintain visual consistency with your brand guidelines. The included sample legend and master layout speed up customization, helping teams deliver professional results under tight deadlines.
Who is it for
Business analysts, project managers, and marketing strategists can harness this wheel chart to break down multi-layered data, track performance metrics, and communicate strategic priorities. Consultants, product managers, and educators will also find it invaluable for workflow mapping, market segmentation, and training presentations.
Other Uses
Apart from hierarchical data, repurpose this wheel chart to illustrate life cycle stages, resource allocation, budget breakdowns, or competitive landscape analyses. It also works well for stakeholder mapping, brand strategy frameworks, and customer journey overviews, providing a versatile foundation for diverse presentation needs.
Login to download this file

Item ID
SB03869