


Genogram-PowerPoint-Templates
Description
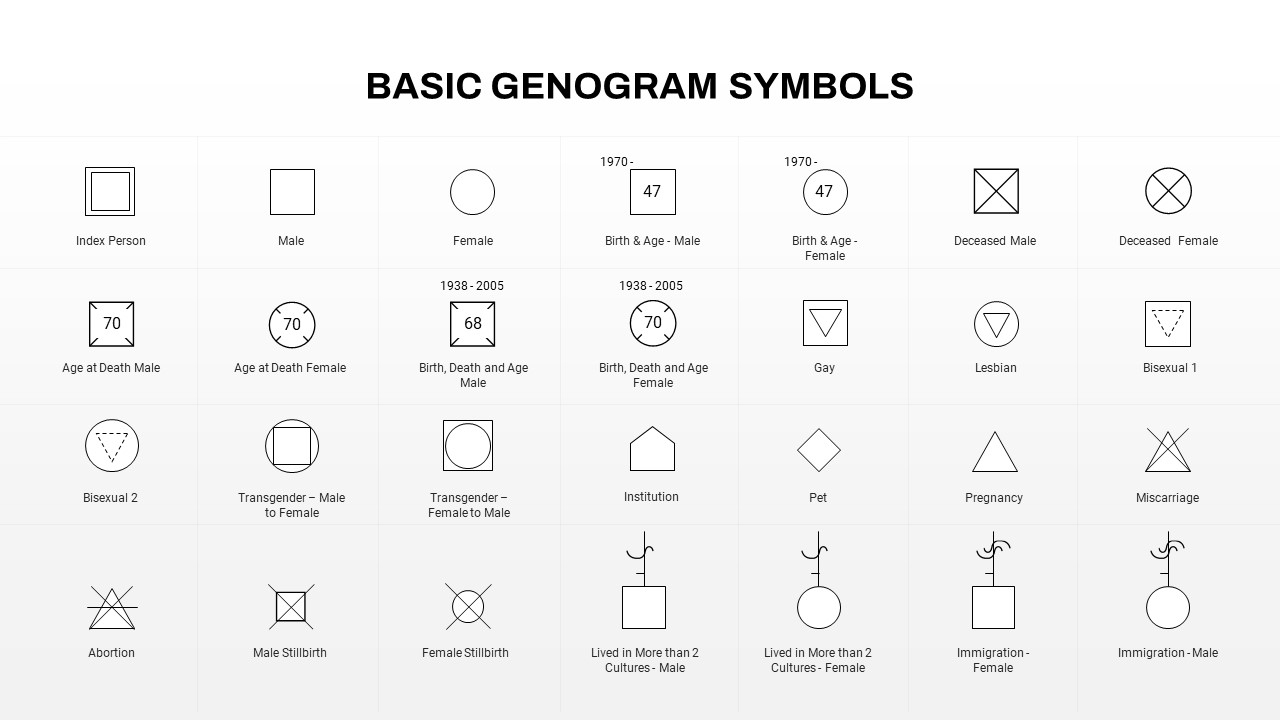
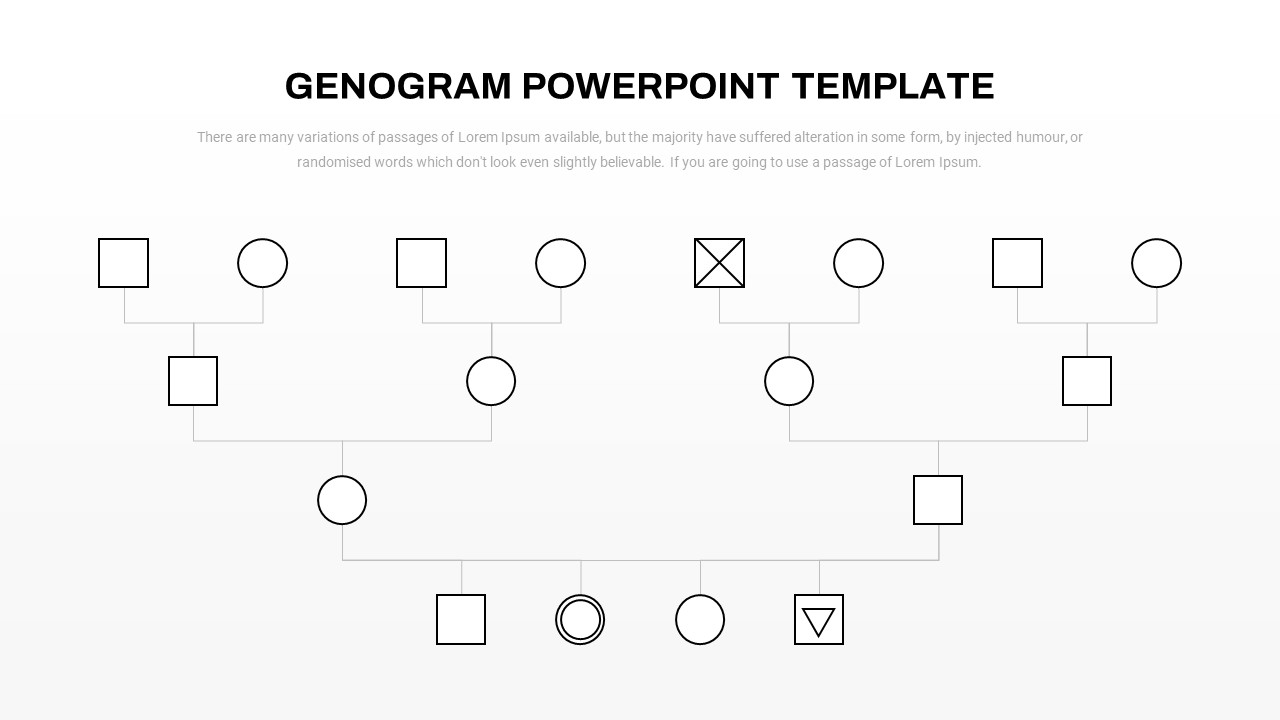
Leverage this genogram family tree diagram to map multigenerational relationships with precision and clarity. This editable slide features standard genogram symbols—squares for males, circles for females, crossed shapes for deceased individuals, and specialized icons for probands and unique family statuses. Each node connects through customizable connectors, enabling you to visualize lineage, health history, and relational dynamics across three generations.
The minimalist black-and-white outline design ensures focus remains on critical family connections, while master-slide integration and intuitive placeholders let you adjust shapes, annotations, and layout in seconds. Whether you’re documenting hereditary conditions, planning family history presentations, or conducting therapeutic assessments, this asset adapts effortlessly. Fully compatible with PowerPoint and Google Slides, it preserves formatting across devices and eliminates versioning headaches.
Designed for flexibility, this genogram template supports advanced customization: apply color-coding to highlight specific traits, insert custom labels for events, or expand the structure to accommodate complex family trees. The neutral palette and clean typography align with corporate, academic, or clinical branding, making it suitable for research reports, medical consultations, genealogical workshops, and classroom settings.
Built on fully vector shapes, this template lets you resize symbols without quality loss and adjust line weights to match your branding. Group or ungroup family branches to reorganize nodes swiftly. Leverage master-slide layouts and custom placeholders to standardize text styles and annotations across multiple slides, streamlining presentation consistency when mapping complex genealogies or health histories.
Ensure cross-platform fidelity when collaborating across desktop and online PowerPoint or Google Slides—connectors and shapes remain intact, eliminating formatting headaches. The high-contrast outline design produces print-ready handouts and integrates seamlessly with corporate or academic templates. Optionally apply colored overlays to highlight specific relationships, generational cohorts, or health risk factors, converting the genogram into a dynamic analytical tool for family studies, medical reviews, or organizational mapping.
Who is it for
Genealogists, family therapists, medical professionals, and social workers will find this genogram indispensable for illustrating inheritance patterns, relational tensions, or psychological dynamics. Educators, researchers, and presentation specialists can also leverage its clarity to engage audiences in workshops or academic conferences.
Other Uses
Beyond family history mapping, repurpose this diagram for organizational charts, stakeholder analyses, decision trees, or network diagrams. Use the adaptable connector framework to visualize project hierarchies, corporate structures, or community networks, ensuring cohesive storytelling across contexts.
Login to download this file
Add to favorites
Add to collection

Item ID
SB03842