


Six Stage Diagram 1
Description
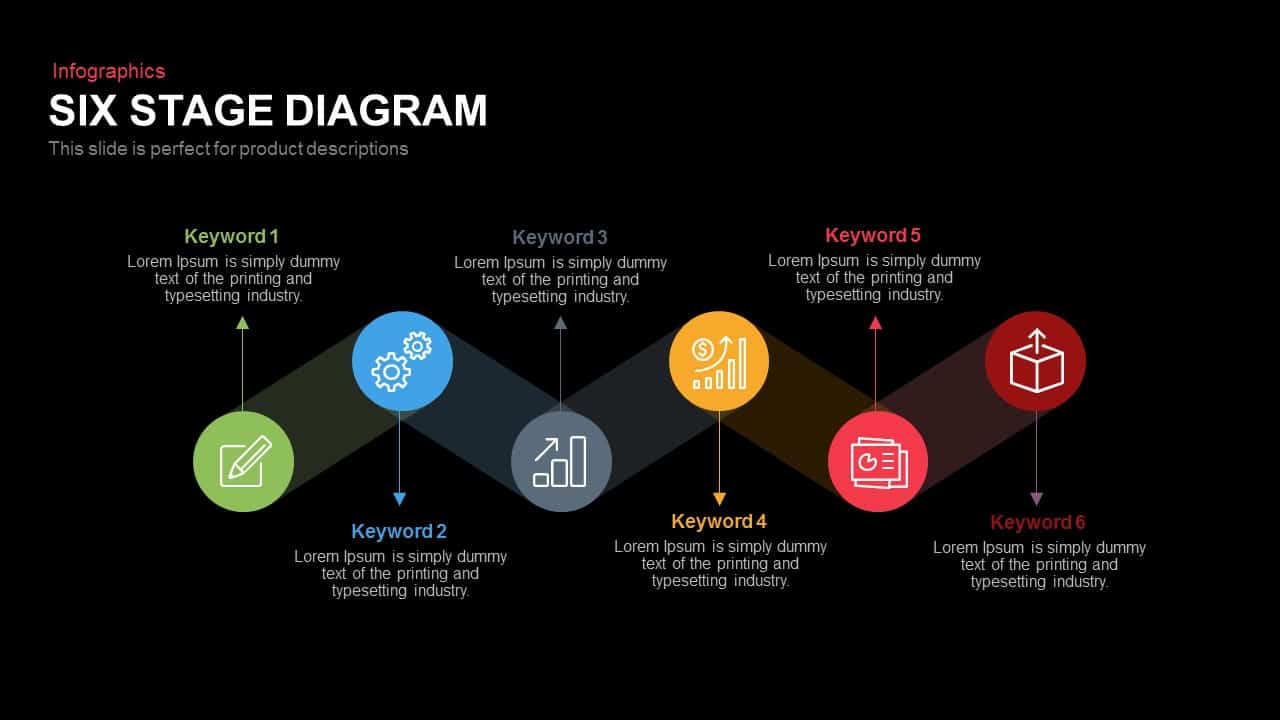
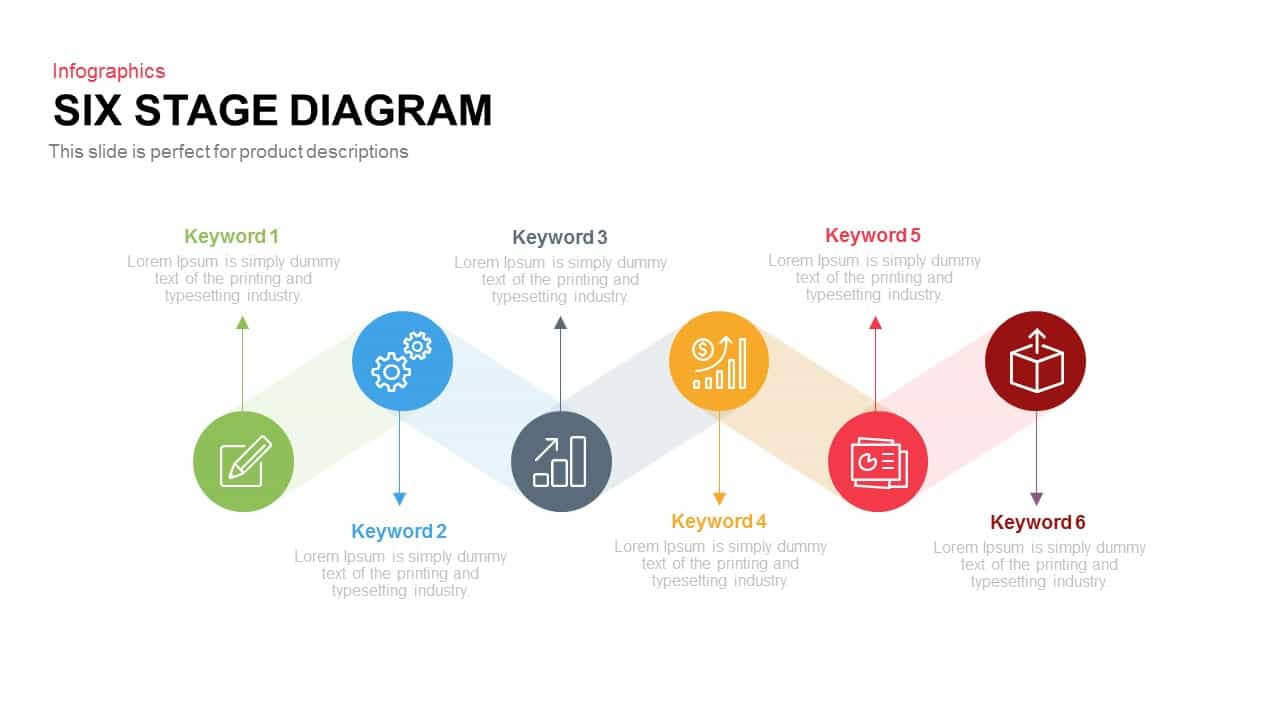
Leverage this six-stage zigzag process diagram slide to illustrate sequential workflows, project milestones, or strategic roadmaps with a distinctive zigzag layout. Six color-coded circular icons connected by a dynamic ribbon-like path guide audiences through each step—planning, development, analysis, optimization, reporting, and deployment—while numbered placeholders ensure clarity and emphasis. Vibrant hues of green, blue, gray, orange, red, and maroon contrast against a clean white backdrop, and subtle shadows add dimension without clutter, ensuring your content stands out on any screen or print.
Built on editable master slides for both PowerPoint and Google Slides, this template features vector shapes and intuitive placeholders that enable you to swap icons, adjust step labels, modify path angles, or recolor segments in seconds. Alignment guides and organized layers maintain a consistent design, accelerating slide creation and eliminating version-control issues. Use built-in animations like wipe-ins or fade-ins to reveal each stage sequentially, maintaining audience engagement and reinforcing narrative flow.
The modern flat aesthetic harmonizes with corporate branding and startup visuals alike, making this slide ideal for strategic planning sessions, quarterly reviews, or training workshops. The zigzag path accommodates both linear and branching narratives, allowing you to map complex processes—from product development cycles and marketing funnels to change management frameworks—with precision and professionalism.
This diagram supports integration with data overlays such as progress percentages, callout text boxes, or icons to denote milestones or decision points. Combine this slide with supporting metrics slides for a comprehensive dashboard, or duplicate unique process flows in multi-slide decks to maintain visual consistency. The responsive layout ensures seamless resizing and repositioning for different aspect ratios and screen resolutions, perfect for boardroom TVs, conference printouts, or mobile viewing.
Who is it for
Project managers, business analysts, and marketing strategists will find this diagram invaluable for mapping out detailed processes, tracking project stages, or presenting executive-level roadmaps. Consultants and educators can also leverage its visual clarity for client presentations and training sessions.
Other Uses
Repurpose this slide to showcase multi-phase roadmaps, audit checklists, stakeholder decision trees, or performance review workflows. Duplicate the zigzag path to expand beyond six steps, invert segment order for alternative flow, or integrate data callouts and icons to suit your narrative needs.
Login to download this file
Add to favorites
Add to collection

Item ID
SB00263