


4-QUAD-Chart-PPT-Templates

Description
Elevate your presentations with this eight-slide quad chart infographic pack, offering four dynamic layout variations to visualize four key concepts or data points with clarity and style. The first set features four overlapping circle markers with curled-edge accents, each tinted in vibrant pastel red, blue, yellow, and purple hues, numbered 01 through 04 for quick reference. Below each icon, space is reserved for a bold title and concise description, ensuring your audience can immediately grasp the essence of each quadrant.
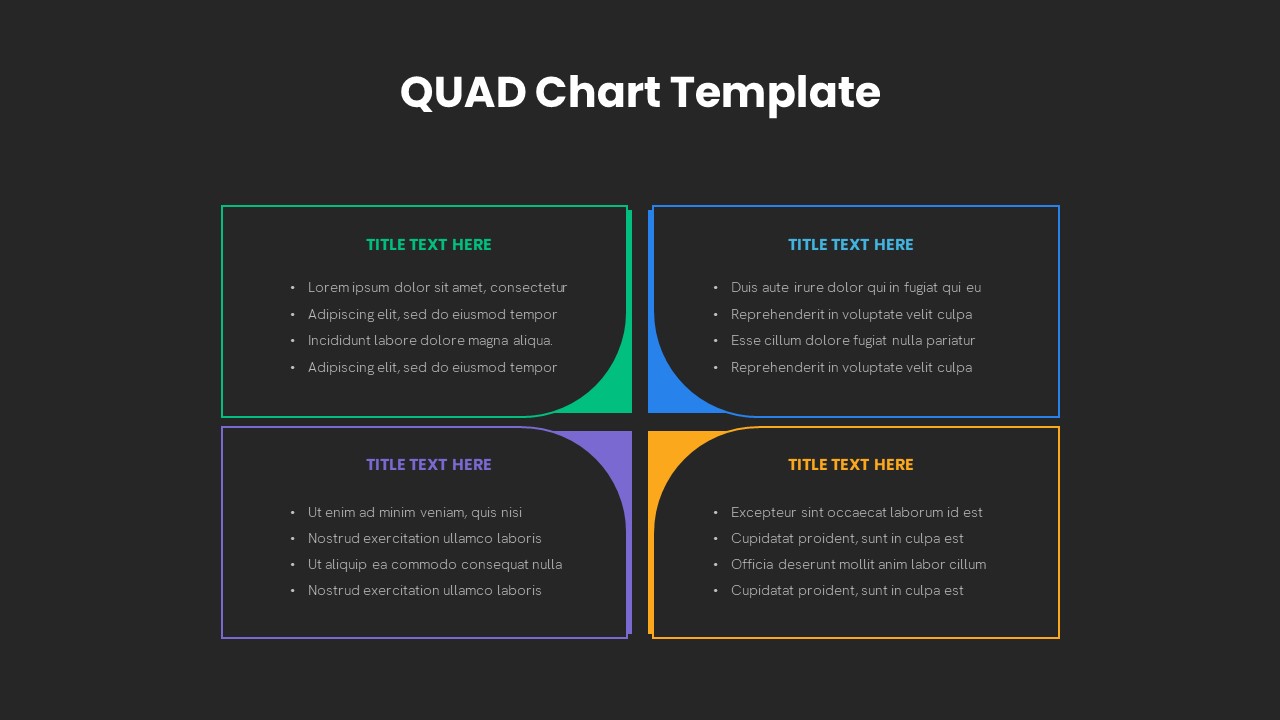
Next, a clean quadrant grid presents four bordered text modules with discreet corner highlights, ideal for bullet-point summaries, project phases, or category lists. Another variation leverages gradient-filled rectangles paired with a central diamond placeholder, creating a focal point for a unifying message or key insight surrounded by four contextual narratives. The final design offers framed quadrants accented by triangular corner elements and subtle dashed guide lines, perfect for directional flows or opposing comparisons.
All eight slides employ consistent master layouts, fully editable shapes, and customizable color themes, enabling seamless adaptation to corporate branding or personal style guidelines. With drag-and-drop placeholders, intuitive text boxes, and organized layer structures, you can update headings, swap colors, or reposition elements in seconds without compromising visual balance. Optimized for both PowerPoint and Google Slides, this pack maintains resolution clarity across devices, streamlines version control, and reduces formatting hassles to keep you focused on content delivery. Whether you’re preparing board presentations, strategic reviews, training workshops, or client proposals, these quad chart layouts help you communicate multifaceted information in an engaging, digestible format.
Who is it for
Business leaders, project managers, consultants, and marketing teams will find this quad chart pack invaluable for presenting strategic comparisons, performance metrics, or segment analyses. Trainers, workshop facilitators, and academic presenters can also leverage these layouts to guide audiences through step-by-step frameworks or multi-dimensional discussions.
Other Uses
Beyond classic quadrant analyses, repurpose these slides for SWOT matrices, risk-impact assessments, product-portfolio evaluations, or audience segmentation. They also work well for illustrating business models, competitive landscapes, decision frameworks, and prioritization grids in a visually compelling way.
Login to download this file
Add to favorites
Add to collection

Item ID
SB03832