


Eight Section Circular Diagram
Description
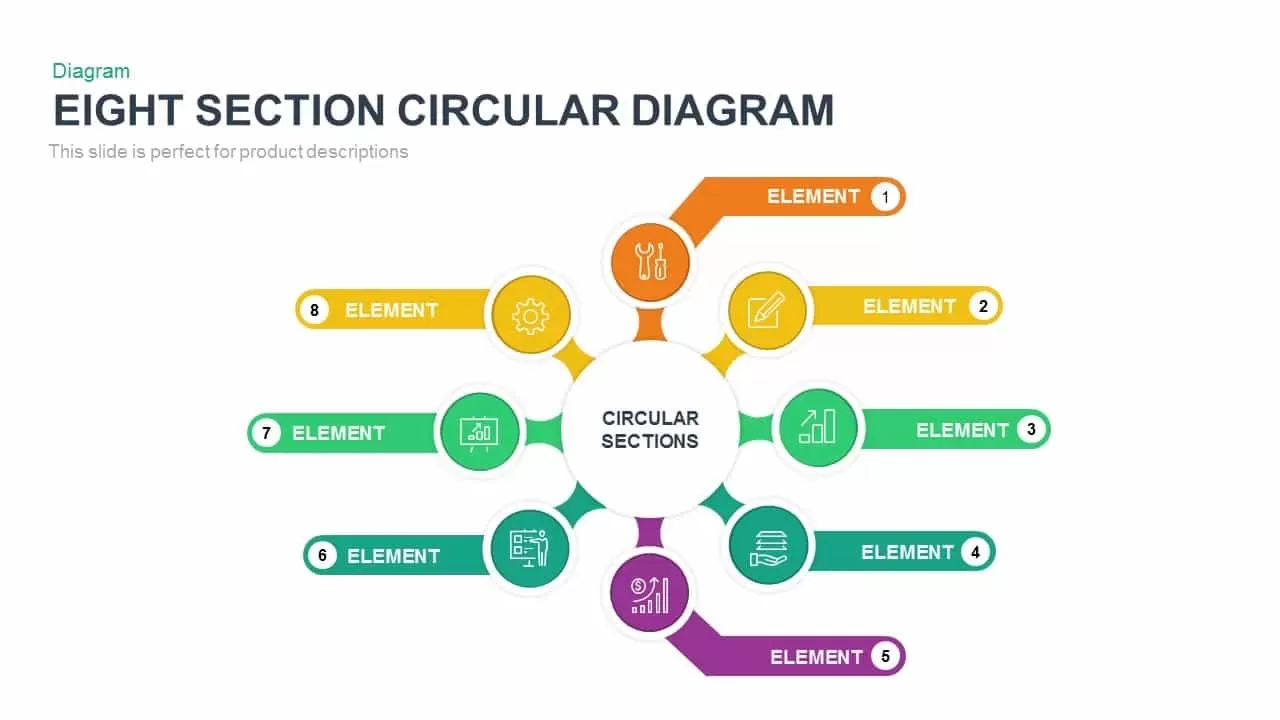
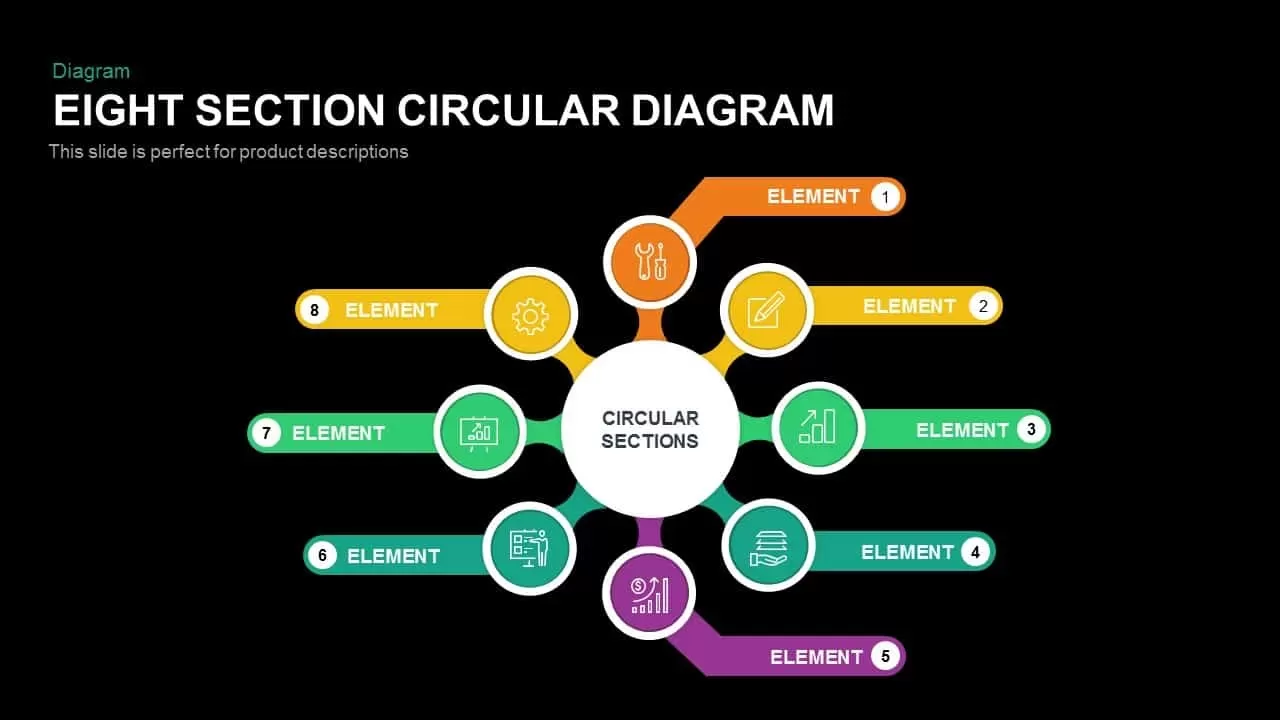
Leverage this eight-section circular diagram slide to illustrate cyclical processes, component relationships, or system overviews in a balanced radial layout. A central hub labeled “Circular Sections” anchors eight color-coded spokes, each terminating in a circular icon and label. The vector icons represent core functions such as development, design, analytics, documentation, finance, training, performance, and configuration. Vibrant hues in orange, yellow, green, teal, purple, blue, lime, and amber contrast elegantly against a clean white backdrop, while subtle drop shadows and crisp typography add depth and enhance readability without clutter.
Built on editable master slides for both PowerPoint and Google Slides, this template empowers users to swap icons, edit text fields, adjust segment order, or recolor elements in seconds. Intuitive alignment guides ensure precise positioning across different screen sizes and print formats, streamlining slide creation and preserving design consistency. With vector-based shapes and organized layers, customization is effortless—even under tight deadlines—eliminating version-control headaches and accelerating presentation prep.
Employ entrance animations like radial wipes or fade-ins to reveal each spoke sequentially, guiding audience focus through your narrative. The flat, modern aesthetic harmonizes with corporate branding and startup visuals alike, while the balanced composition accommodates both analytical reports and strategic presentations. Whether you are mapping a product lifecycle, showcasing departmental responsibilities, or outlining strategic frameworks, this circular diagram delivers professional polish and ensures complex information is communicated clearly.
The modular design also supports expansion beyond eight elements. Simply duplicate or rearrange spokes, swap icons for custom visuals, or layer data callouts to highlight metrics and insights. The adaptable layout works seamlessly in executive briefings, training workshops, marketing meetings, and boardroom sessions, making this slide a versatile asset for any industry. Elevate your presentations with a dynamic, visually engaging infographic that simplifies complexity and drives stakeholder alignment.
Who is it for
Project managers, marketing teams, and business analysts will benefit from this circular diagram for mapping lifecycle stages, illustrating strategic frameworks, or presenting collaborative workflows. Consultants and educators can also leverage it for teaching complex concepts.
Other Uses
Use this slide to depict organizational structures, process flows, risk assessments, or audit cycles. Extend spokes for additional steps, integrate icons for varied functions, or adapt color schemes to align with brand guidelines.
Login to download this file

Item ID
SB00260