


Stoplight-Chart-PPT-Template
Description
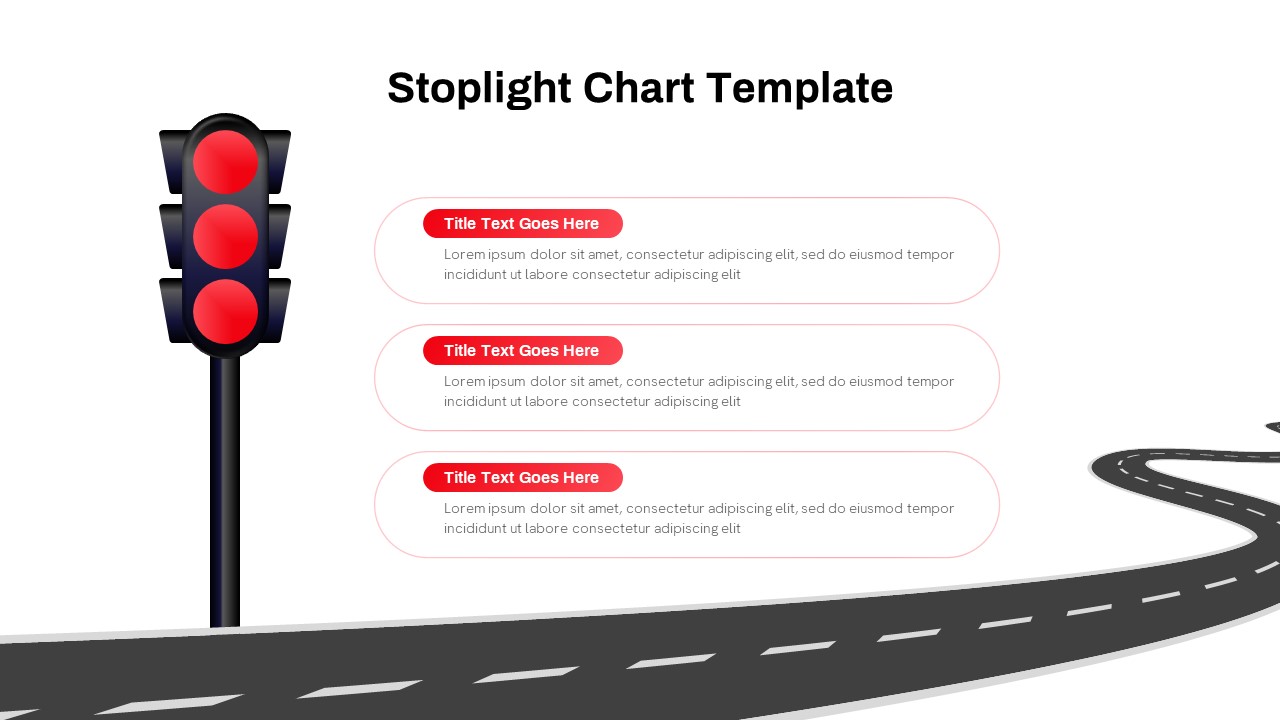
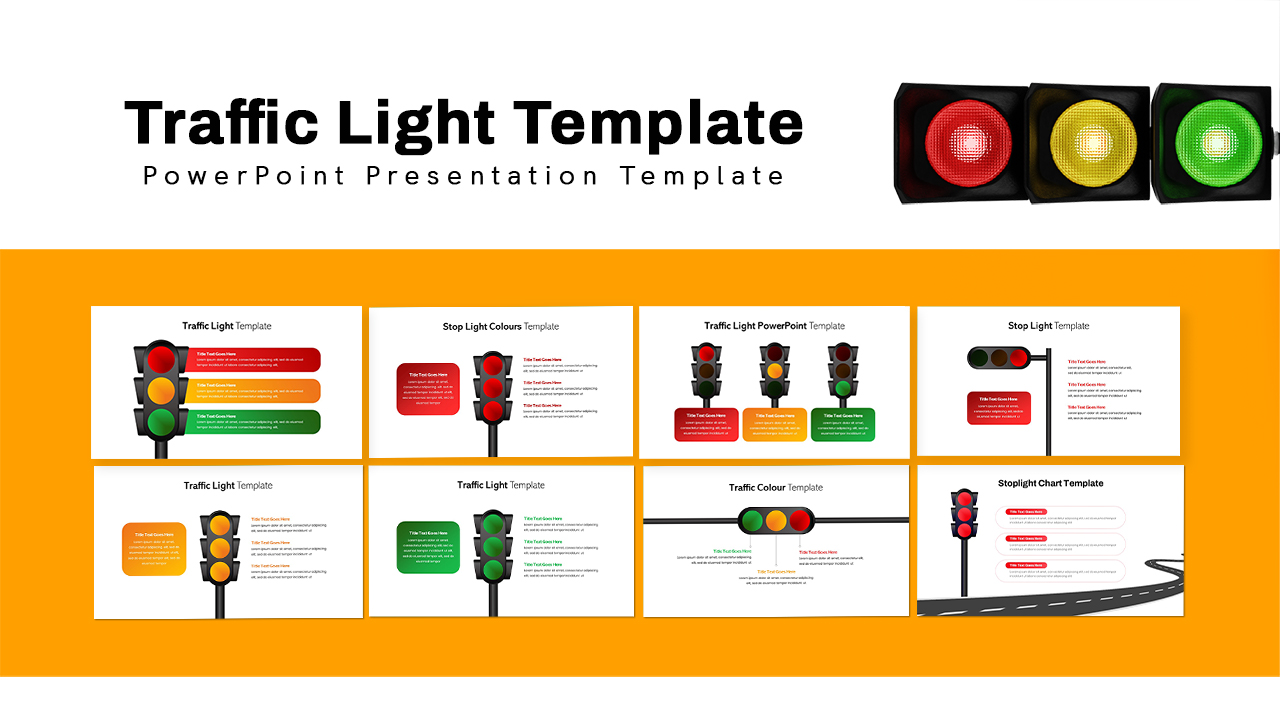
Leverage this traffic light infographic pack template to enhance visual storytelling with eight versatile slide designs. Each template features traffic-light-themed graphics—vertical pillars, horizontal bars, circular status nodes, curved roadmaps, checklist boards, and process flows—color-coded in red, yellow, and green to denote stop, caution, and go conditions. Clean white backgrounds, crisp vector icons, and subtle drop shadows create a modern aesthetic that highlights key messages without clutter.
This fully editable toolkit is built on master slides compatible with both PowerPoint and Google Slides. Swap icons, adjust light colors, and reposition text placeholders with a few clicks. Ready-to-use color palettes and custom fonts ensure brand consistency, while alignment guides guarantee pixel-perfect layouts and seamless cross-platform performance.
Slide variations include stacked labels beside signal posts, horizontal light sequences within timeline charts, list-based stoplight indicators, and curved connector lines illustrating process cycles. Numeric badges and caption boxes support concise data annotations, making these designs ideal for KPI dashboards, risk assessments, or project-status reports.
Project managers, business analysts, data scientists, and executive teams will appreciate the clarity and impact these infographics bring to stakeholder briefings, performance reviews, and strategic roadmaps. Learning and development professionals and consultants can leverage the metaphoric stoplight visuals for teaching risk management, workflow optimization, or decision-making frameworks.
Beyond traffic light contexts, repurpose these templates for priority mapping, compliance checklists, feature rollouts, and color-based category comparisons. Use the cohesive design system to craft engaging dashboards, summary slides, or printed posters, ensuring your audience quickly grasps complex information at a glance.
Who is it for
Project managers, business analysts, data scientists, executive teams, and L&D professionals will benefit from these infographics when reporting status, assessing risk, or guiding decision-making workshops.
Other Uses
Repurpose for priority mapping, compliance audits, feature roadmap visualizations, or color-coded category comparisons. Ideal for KPI dashboards, printed posters, or interactive e-learning materials.
Login to download this file
Add to favorites
Add to collection

Item ID
SB02359