


United Kingdom UK Counties Map PowerPoint

Description
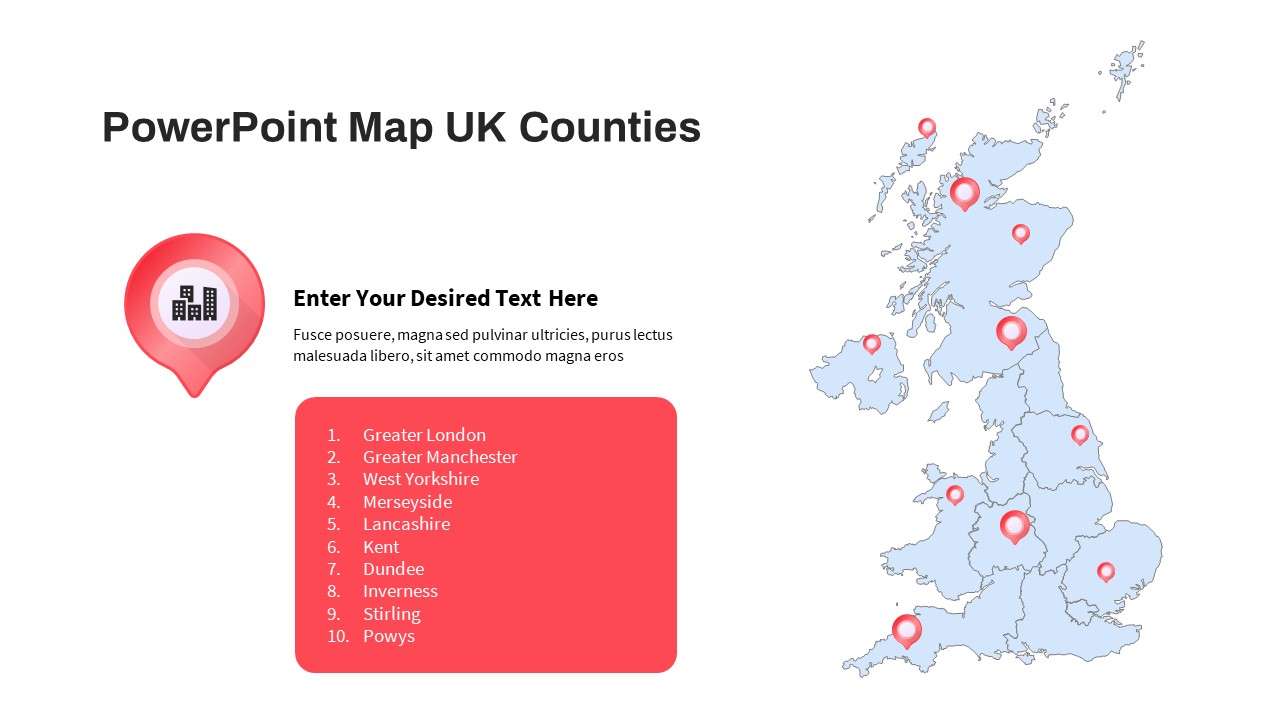
Effortlessly illustrate regional insights with this comprehensive UK counties map template, offering multiple slide layouts to suit a variety of data-driven narratives. The main map slide presents each county in a distinct hue—blue, orange, purple, and green—paired with icon-led text blocks for four key datapoints. Alternate layouts include pinpoint callouts (labeled A, B, C) with weather and transport icons, a customizable bar chart overlay beside a highlighted-county map, and connector lines leading to metric callout boxes. Each element is built on vector shapes and masters, enabling you to recolor counties, reposition markers, or swap icons in seconds.
Designed for both PowerPoint and Google Slides, this template leverages master slides and alignment guides to maintain perfect spacing and consistency across all layouts. High-resolution map vectors ensure crisp rendering on screens of any size, while editable text placeholders let you replace sample headlines and descriptions without disrupting design integrity. Whether you need to showcase sales territories, demographic distributions, or logistics hubs, this map toolkit adapts to your story with minimal effort.
With fully editable color schemes and icon sets, you can align the visuals with your brand palette or presentation theme. Simply duplicate the slide you need, update the county fills and marker positions, then insert your own data charts or callouts. The result is a polished, data-driven slide deck that brings UK regional analysis to life.
Who is it for
Sales leaders, market researchers, and logistics managers will find this map template invaluable for territory planning, customer segmentation, or distribution network presentations. Government agencies and policy analysts can also leverage it for demographic reporting and resource allocation briefs.
Other Uses
Beyond business analytics, repurpose this template for election results mapping, tourism trail overviews, real estate market analyses, supply chain visualizations, or educational geography lessons.
Login to download this file

Item ID
SB03799