


Thermometer Chart ppt Template

Description
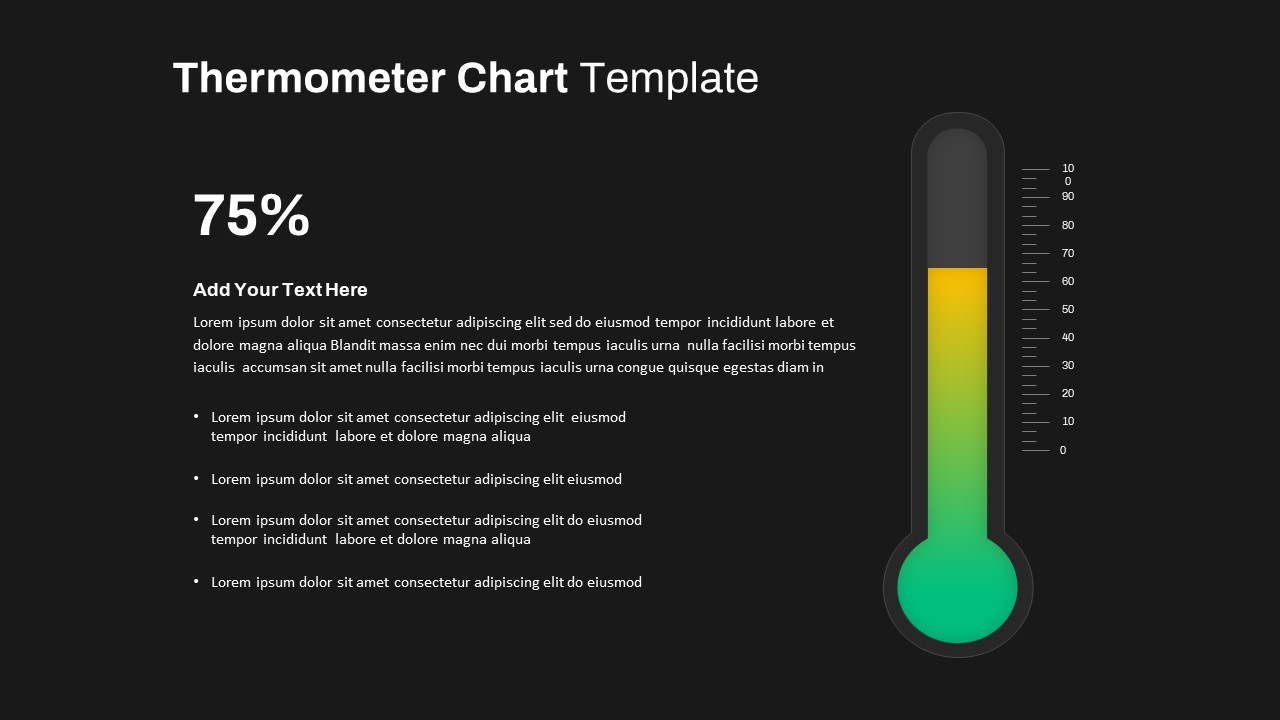
Leverage this multi-variation thermometer chart template pack to visualize progress, performance metrics, and goal attainment across three flexible slide layouts, including a six-level segmented thermometer, a full-range gradient fill design, and a comparative dual-thermometer slide. The vertical thermometer shapes feature vector-based graphics arranged in clean outlines with subtle drop shadows. The segmented variant is divided into six numbered bands from red at the base through purple, orange, blue, cyan, to green at the top, enabling audiences to track discrete milestones. The single gradient slide displays a continuous fill up to any percentage with corresponding scale markings and a prominent numeric label, while the dual layout offers side-by-side thermometers for comparative KPI analysis. Each slide provides editable text zones for titles, descriptive paragraphs, percentage indicators, and bullet insights without overcrowding the layout. Built on master slides for both PowerPoint and Google Slides, this asset supports rapid customization: resize shapes without quality loss, swap color schemes, modify fonts, or update data points in seconds. A crisp white background and modern sans-serif typography deliver a distraction-free aesthetic that adapts to corporate or creative branding contexts. Integrated alignment guides and intuitive placeholder controls streamline slide creation under tight deadlines. The high-resolution vector elements maintain pixel-perfect clarity across displays, printed reports, and virtual presentations. Whether you are showcasing fundraising thermometers, sales targets, project status, or departmental comparisons, this versatile template pack empowers presenters to tell clear, data-driven stories. Numbered and unnumbered fill options guide audience focus, enhance comprehension, and reduce interpretation errors, making complex metric reporting simple, engaging, and persuasive.
Who is it for
Marketing managers, sales leaders, project managers, financial analysts, and nonprofit fundraisers will benefit from this template when presenting progress trackers, KPI overviews, or comparative performance analyses.
Other Uses
Repurpose this slide set for budget utilization reports, compliance tracking, training milestones, customer satisfaction dashboards, or employee performance reviews. Duplicate, recolor, or relabel thermometers to suit any measurement-based narrative.
Login to download this file

Item ID
SB03776