


Tree Diagram
Description
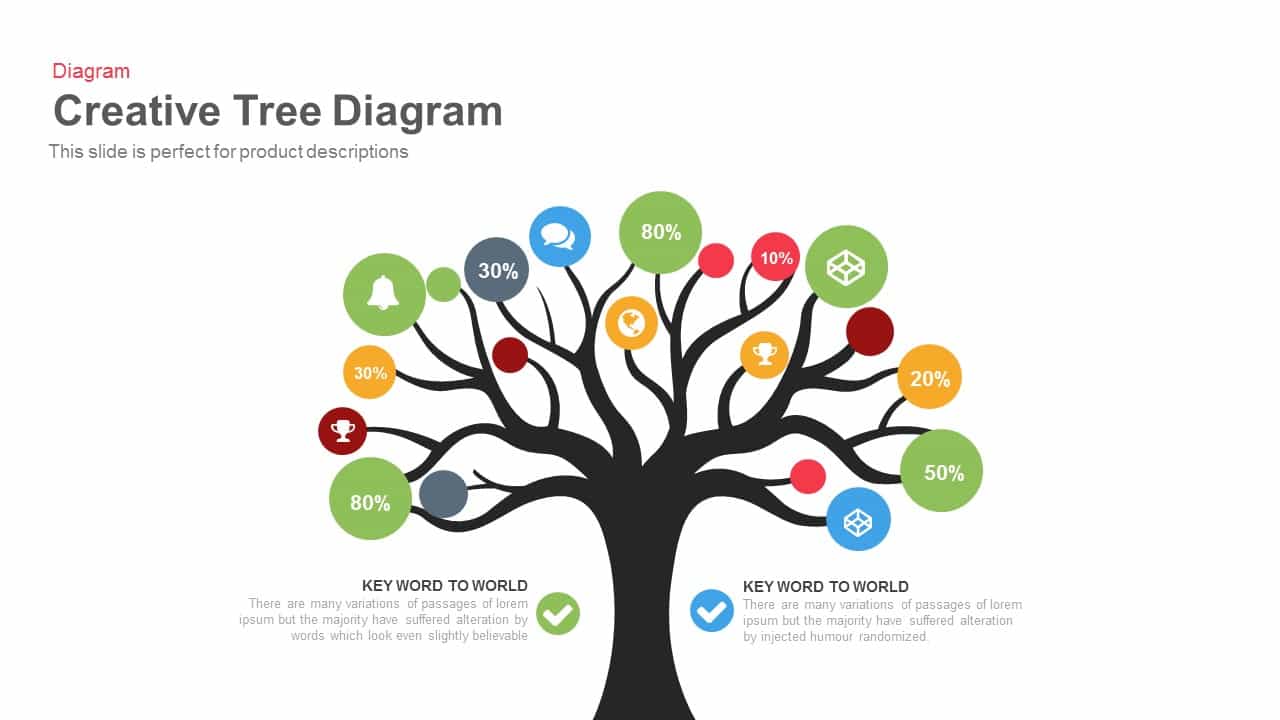
Developed to bring data-rich narratives to life, this engaging creative tree diagram slide provides a dynamic way to showcase product descriptions, feature breakdowns, or performance metrics. The central black tree trunk branches into multiple limbs holding colorful circular nodes, each containing an icon and percentage value. Green nodes highlight positive metrics at 80% and 50% rates, blue nodes emphasize communication or system metrics, red and orange nodes flag lower performance or cautionary values, and gray nodes offer neutral data points—making it easy to compare metrics at a glance. The clean white background and consistent iconography ensure clarity, while the flowing branch lines guide the viewer’s eye naturally from the trunk to each data point.
Built on master slides with fully editable shapes and icon placeholders, you can quickly swap icons, update percentage values, and customize colors to align with your brand guidelines. Advanced users can leverage the built-in icon library and drag-and-drop branch duplications to represent additional data categories without rebuilding the layout. With quick style swapping and theme presets, you can ensure a consistent look and feel across your entire presentation in seconds. Full support for high-resolution graphics guarantees crisp display on any device, and compatibility with both PowerPoint and Google Slides eliminates formatting headaches during collaboration.
Simply replace the placeholder text areas at the bottom of the slide to add concise headings, key takeaways, or descriptive context. Whether you need to highlight top-performing product features, illustrate seasonal trends, or break down user segment performance, this slide adapts seamlessly to a variety of content scenarios. Its visually engaging design has been crafted to boost audience engagement in executive briefings, marketing roadshows, stakeholder workshops, or sales pitch decks.
Who is it for
Product managers, marketing teams, business analysts, data strategists, and sales professionals will benefit from this tree diagram slide when presenting complex metrics, product roadmaps, or feature comparisons.
Other Uses
Apart from product descriptions, repurpose this slide to visualize organizational structures, process hierarchies, customer segmentation, technology roadmaps, or performance audit results. Duplicate and customize branches to craft team introductions, feature roadmaps, or KPI dashboards with minimal effort.
Login to download this file
Add to favorites
Add to collection

Item ID
SB00244