


Timeline Chart Ppt Template

Description
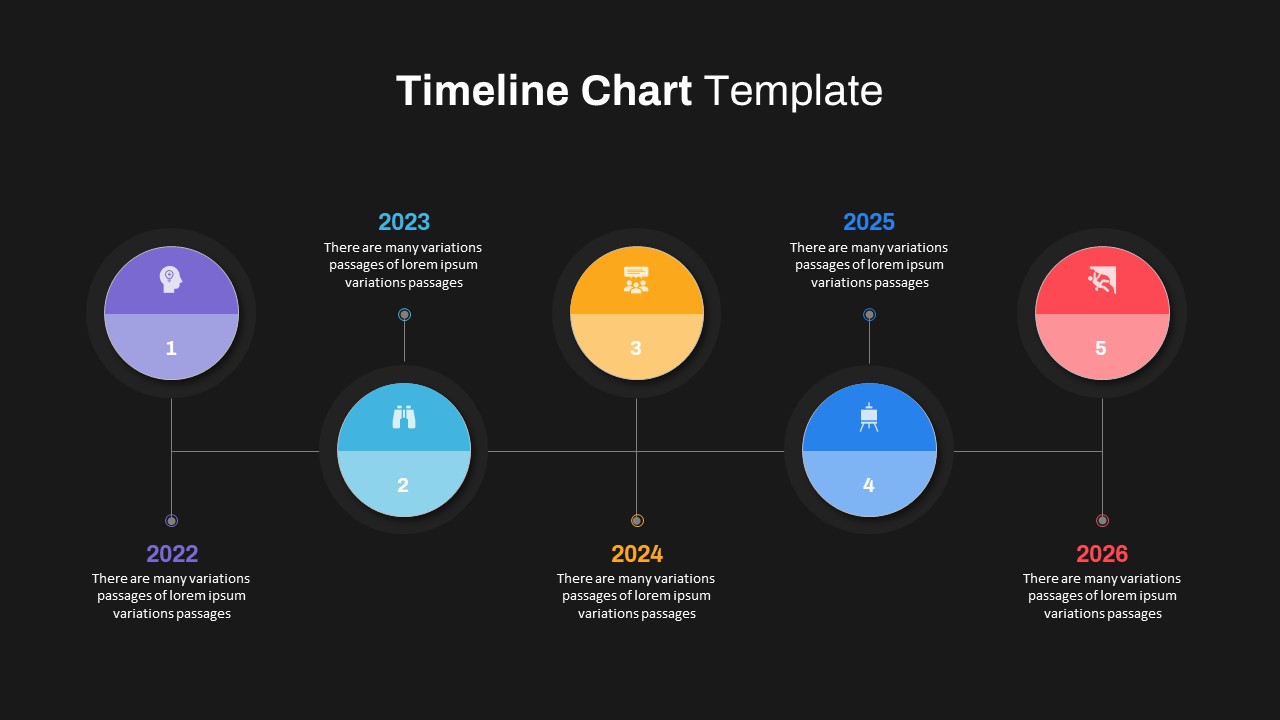
This slide presents a clean horizontal timeline with five color-coded circular milestones representing the years 2022 through 2026. Each circle is split into two tonal halves—darker on top and lighter below—and features a bold step number alongside a thematic icon: idea generation, vision scouting, team alignment, detailed planning, and execution kickoff. Connected by a thin baseline and short vertical stems, the markers align with year labels and concise descriptive text placed alternately above and below the axis. Subtle drop shadows around each circle and consistent sans-serif typography ensure visual hierarchy and legibility on any screen or print medium.
Built on editable vector shapes and master slide layouts, this template allows users to quickly adjust colors, icons, and text placeholders. The flexible structure supports adding or removing milestone points without breaking alignment, and hidden guide layers simplify repositioning or orientation changes. All icons and shapes scale without loss of quality, while theme fonts adapt to user branding with a single click. Perfectly compatible with PowerPoint and Google Slides, the slide retains exact spacing and resolution across platforms and devices, removing version-control headaches. Whether working in a virtual workshop, an executive briefing, or a printed report, presenters can rely on this design to streamline content updates and maintain a polished, professional look. The minimalist white background and vibrant hues strike a balance between clarity and engagement, guiding audiences smoothly through complex multi-year initiatives.
With its modular five-stage layout, this asset is ideal for illustrating strategic roadmaps, project launch schedules, product development phases, or marketing campaign timelines. Users can repurpose the timeline by swapping icons for category-specific visuals, refining label text, or toggling drop-shadow effects. The master slide includes alternate format options—such as vertical orientation or color-theme swaps—giving teams flexibility to match internal style guides. Editable connectors allow highlighting dependencies, milestones, and deliverables in high-stakes presentations. By leveraging this fully customizable timeline chart, organizations can drive stakeholder alignment, track progress across global and regional projects, and present chronological data with maximum impact and minimal effort.
Who is it for
Strategic planners, project managers, and product teams will benefit from this five-phase timeline when mapping multi-year initiatives. Marketing directors, operations leads, consultants, and executive teams can use its clear sequence to align stakeholders and communicate complex schedules.
Other Uses
Beyond annual roadmaps, repurpose this timeline for event planning schedules, training program outlines, fundraising milestones, hiring pipelines, or release management plans. Adjust colors, icons, and labels to suit any sequential narrative or project lifecycle.
Login to download this file
Add to favorites
Add to collection

Item ID
SB03736