


Success Key Diagram1

Description
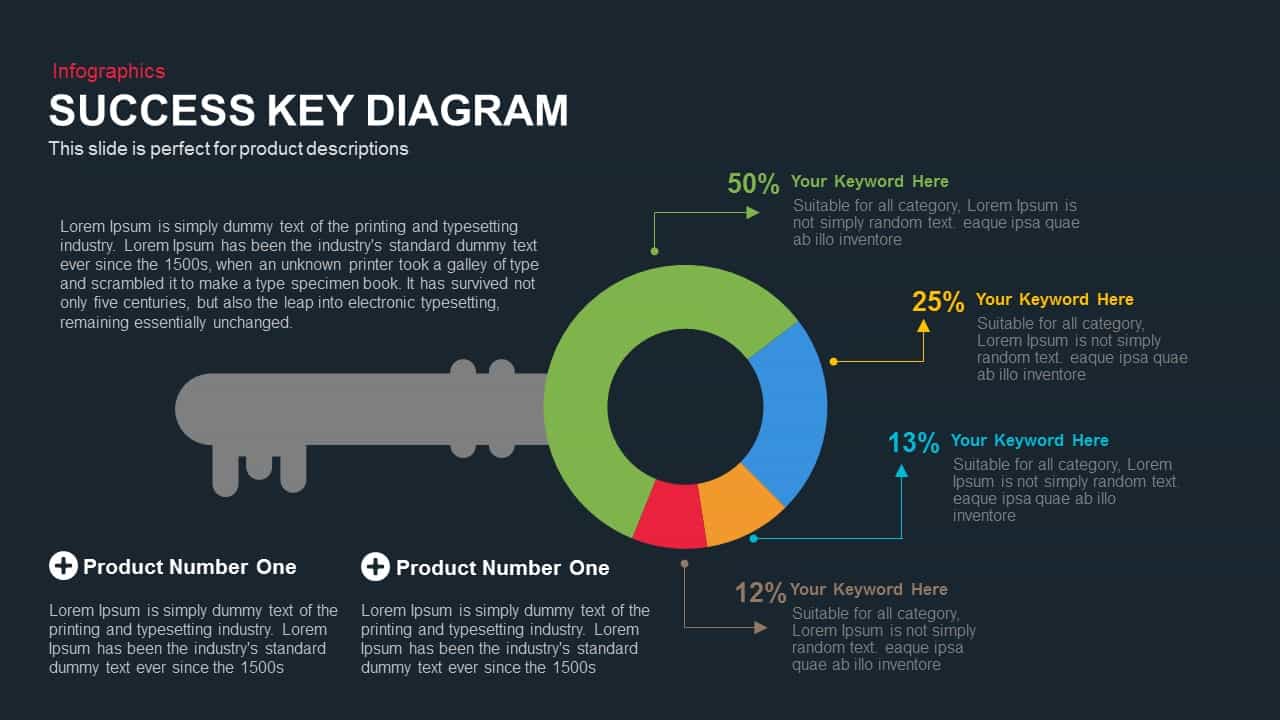
Use this “Success Key Diagram” slide to visualize critical performance metrics and success factors using a distinctive key-shaped infographic. At its core, a central donut chart divides your data into four colored segments—green, blue, orange, and red—highlighting proportional insights such as 50%, 25%, 13%, and 12% with matching callouts. Each callout features a percentage label, headline placeholder, and brief description block, enabling clear annotation of KPIs, performance drivers, or strategic milestones. The doughnut sits in the head of a subtle gray key silhouette, reinforcing themes of unlocking success, access, and solutions.
The balanced composition pairs a headline area and summary text on the left with metric callouts on the right, maintaining visual flow and readability. Two product placeholders at the bottom allow you to spotlight offerings, features, or service components, complete with plus-mark icons and editable text captions. With fully customizable shapes, colors, and text boxes, you can update percentages, adjust segment hues, swap icons, or replace labels in seconds.
Designed for both PowerPoint and Google Slides, this slide leverages master layouts and responsive alignment to ensure pixel-perfect rendering and hassle-free formatting across devices. The flat design aesthetic, crisp typography, and intuitive placeholders reduce preparation time and adapt seamlessly to corporate branding. Whether presenting quarterly results, customer segmentation, or strategic roadmaps, this key-themed infographic drives engagement and clarity by combining familiar metaphors with precise data visualization.
Customize the two bottom sections to highlight specific products or services with plus-mark icons, creating a focused overview of feature sets or service tiers. The editable color palette ensures brand consistency, while the callout lines help guide viewers’ eyes to relevant statistics. Ideal for C-level reports, training materials, or sales decks, this diagram accelerates comprehension and retention.
Who is it for
Marketing managers, product owners, and business analysts will benefit from this infographic when presenting key performance indicators, growth metrics, or strategic roadmaps. Executive teams, sales directors, and consultants can leverage the key-shaped metaphor to emphasize success factors and unlock stakeholder engagement.
Other Uses
Beyond success metrics, repurpose this diagram for project status updates, customer segmentation analysis, or training modules. Apply the donut chart and callouts to display budget allocations, resource utilization, or risk assessments with clarity and impact.
Login to download this file
Add to favorites
Add to collection

Item ID
SB00240