


cause and effect fishbone ppt slide
Description
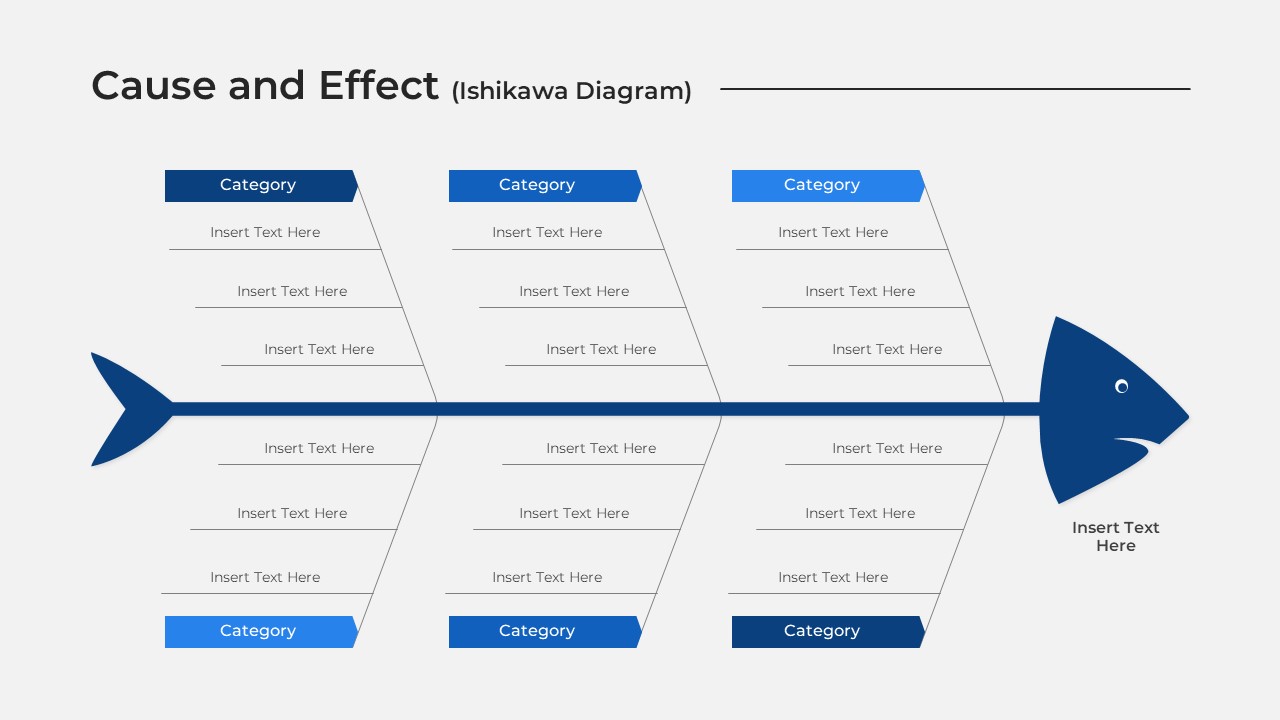
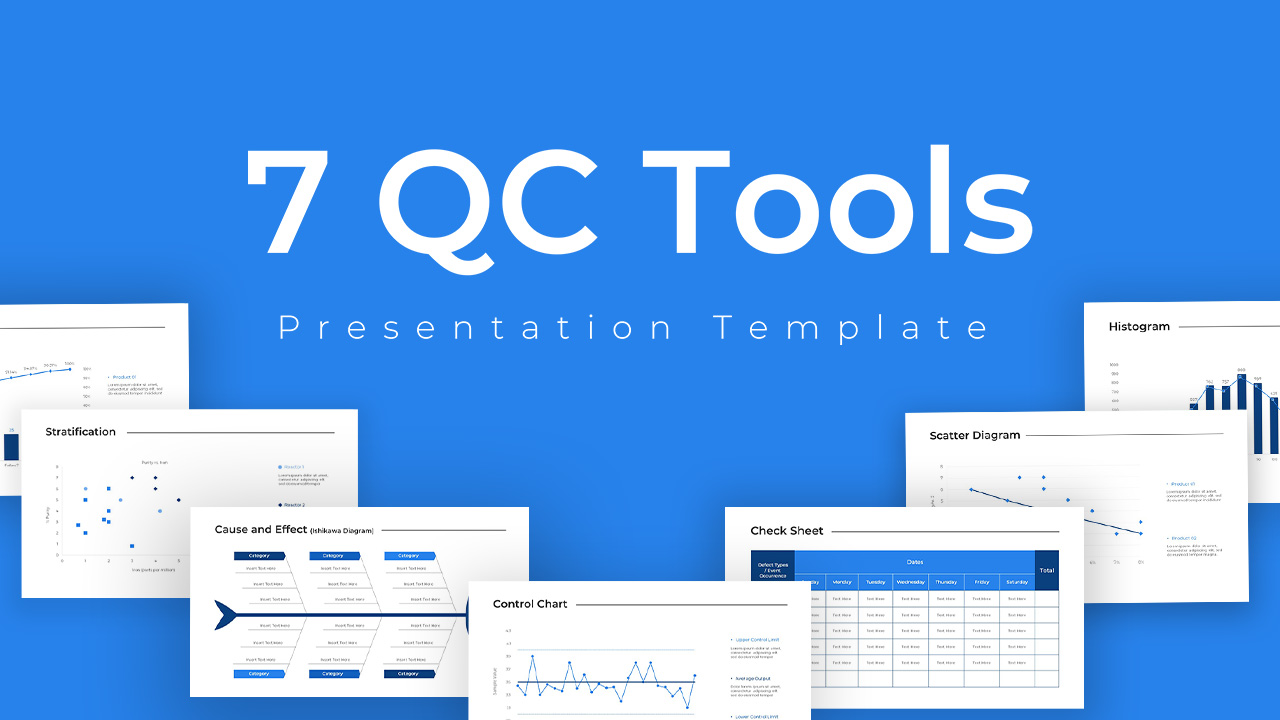
Drive quality improvement and data-driven decision making with this comprehensive QC tools diagram template, featuring all seven classic quality control instruments. Each slide presents a clean, white background and intuitive chart elements:
A fully editable Cause and Effect (Ishikawa) diagram with six category branches for structured root-cause analysis.
A customizable Check Sheet grid for defect tracking and event quantification on daily or weekly intervals.
A balanced Histogram chart to visualize frequency distributions and highlight process variation.
A dual-axis Pareto Diagram combining bar and cumulative percentage curves for 80/20 analysis.
A Scatter Diagram with trendline to explore correlations between variables.
A precise Control Chart with upper/lower control limits and average line to monitor process stability.
A versatile Stratification (multi-series scatter) slide to segment data by category and uncover hidden patterns.
Built entirely with vector shapes, color and text placeholders, and PowerPoint/Google Slides masters, you can adapt each tool’s color palette, axis labels, and data points in seconds. The minimal blue accent color palette ensures clarity, while the slide masters preserve consistent formatting and typography across all seven instruments. Whether you’re documenting product defects, analyzing process performance, or conducting training workshops, this template library streamlines your workflow and enhances audience engagement.
Who is it for
Quality managers, process engineers, operational excellence teams, and Lean Six Sigma practitioners will benefit from these slides when performing root-cause analysis, process monitoring, or data stratification. Trainers, consultants, and academic instructors can also use this deck for educational sessions and certification workshops.
Other Uses
Beyond traditional QC applications, repurpose these diagrams for risk assessments, performance reviews, stakeholder presentations, and business audits. Use the check sheet for inventory tracking, the Pareto chart for sales analysis, or the scatter slides for market research correlations.
Login to download this file
Add to favorites
Add to collection

Item ID
SB03697