


Pebble Stack Layer Diagram Powerpoint Keynote
Description
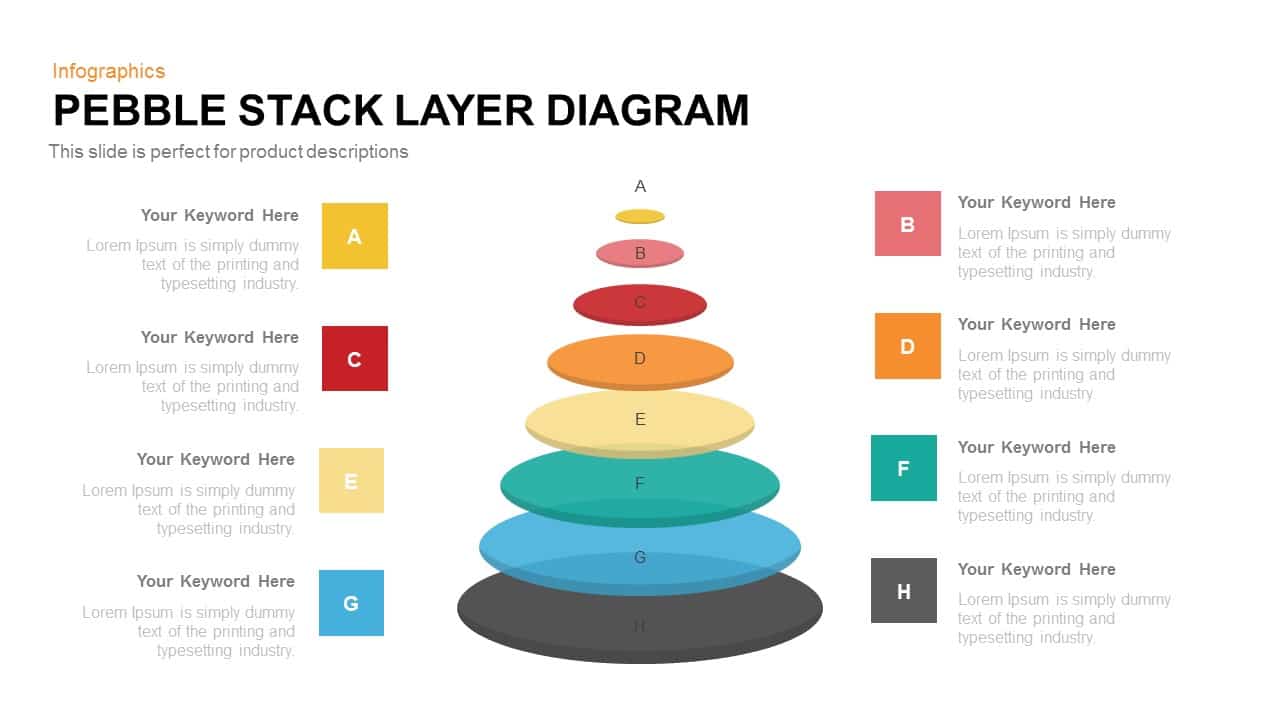
The Stack Layer Diagram template features a series of eight pebble-shaped layers stacked to form a modern, tiered infographic ideally suited for presenting product descriptions, service levels, or tiered strategies. Each layer is color-coded and clearly labeled from top to bottom, allowing you to guide audiences through hierarchical data with intuitive visual cues. The clean, flat design employs smooth curves and vibrant hues to maintain audience focus on content rather than decorative elements.
Built on fully editable master slides, this PowerPoint and Google Slides asset lets you customize colors, fonts, labels, and layer count in seconds. Vector-based shapes ensure sharp output on any display, while easy drag-and-drop placeholders streamline content updates. Whether you need wide-screen 16:9 or classic 4:3 ratios, the template adapts seamlessly without distortion.
Designed for professionals seeking polished, clickable visuals, this diagram balances aesthetics and functionality. Icons can be added to each pebble for further clarity, while transparency settings and shadow effects add subtle depth. Ideal for inclusion in executive summaries, pitch decks, or training materials, the slide integrates smoothly with existing brand guidelines and corporate color schemes.
Its modular architecture supports adding or removing layers to match eight, seven, or any number of steps, making it versatile for mapping technology stacks, OSI layers, maturity roadmaps, and pricing tiers. The template comes with sample text and color themes, so you can jump-start your design or apply custom palettes to align with brand guidelines. With intuitive grouping and naming conventions in the slide panel, reorganizing layers and updating content takes just a few clicks, reducing production time and ensuring consistency across presentations. As part of a complete deck, this slide elevates narrative flow and enhances information retention through structured, layered storytelling.
Who is it for
Product managers, marketing strategists, UX designers, business consultants, project managers, and educators will find this slide invaluable when illustrating tiered models or hierarchical frameworks. Startups and corporate teams can leverage the diagram to break down service offerings, pricing plans, or organizational structures. Trainers and analysts can use it in workshops or training sessions to simplify complex multi-layer concepts.
Other Uses
Beyond product descriptions, repurpose this stack layer design for technology architecture maps, pricing tier breakdowns, maturity models, OSI network layers, or service level agreements. It can double as a process flow chart by reordering pebbles horizontally, or as a comparative analysis tool by labeling each layer with metrics. Use it in annual reports, client proposals, or educational modules to enhance clarity.
Login to download this file
Add to favorites
Add to collection

Item ID
SB00211