


5 Steps Business Process Analysis Template PowerPoint Dark
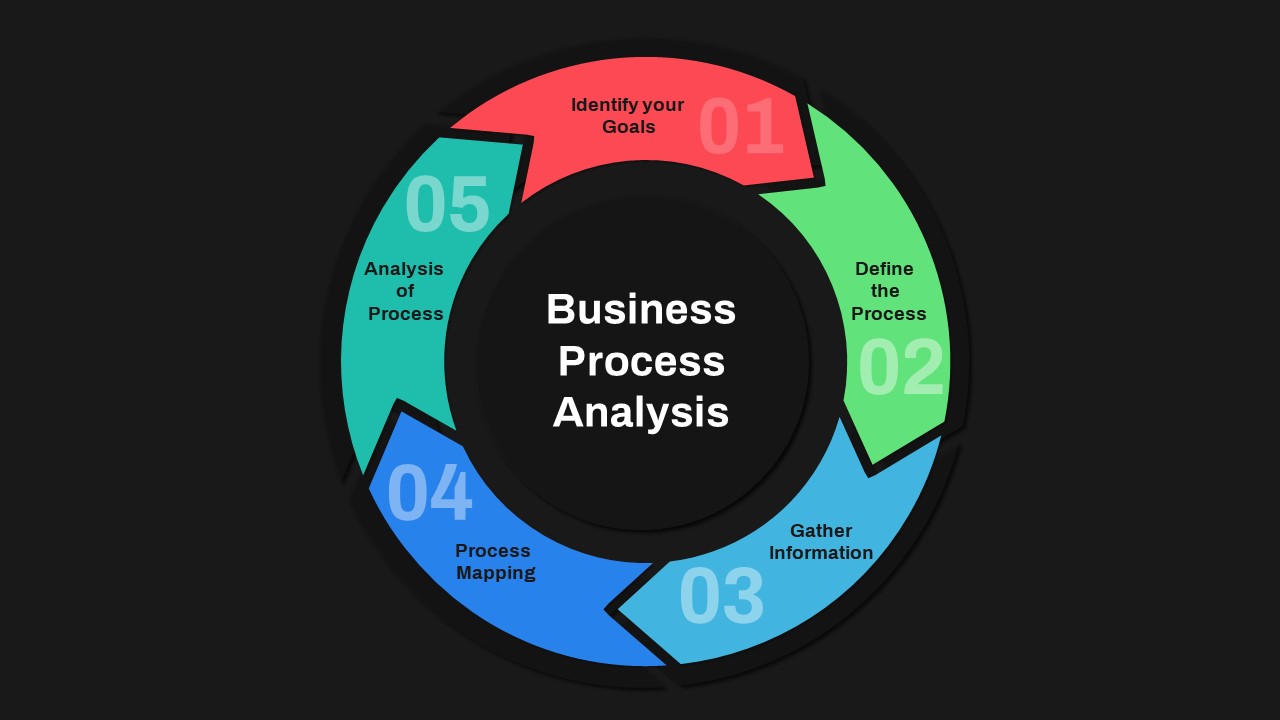

This comprehensive Business Process Analysis cycle diagram slide provides a six-stage, circular infographic that visually maps every phase of process improvement—from initial discovery to ongoing monitoring. Each segment is color-coded and arranged around a central “Business Process Analysis” hub, highlighting the key steps: Process Discovery, Process Analysis, Process Re-Design, Process Implementation, Process Monitoring & Controlling, and Process Identification. The clean white background, subtle drop shadows, and transparent text circles ensure optimal readability, while the flat arrow shapes maintain a modern aesthetic.
Designed for maximum customization, this PowerPoint & Google Slides template includes fully editable colors, icons, and text placeholders. Users can easily adjust segment hues to match brand guidelines, swap icons for relevant process triggers, or modify labels for tailored workflows. Built on master slides, it guarantees consistent styling across multiple decks, and its scalable vector graphics preserve clarity on high-resolution displays.
Engineered for efficiency, this asset streamlines complex process presentations by centralizing information in a clear, cyclical layout. Whether you need to illustrate as-is and to-be process models, pinpoint performance bottlenecks, or outline continuous improvement plans, this versatile diagram adapts to every business context. With intuitive placeholders and drag-and-drop elements, you can update the slide in seconds and maintain alignment across teams.
Beyond traditional process documentation, this slide serves multiple strategic objectives: map project lifecycles, visualize quality audits, present Six Sigma roadmaps, or support change management workshops. Simply duplicate the circular chart, reassign labels, and repurpose the layout for training sessions, executive briefings, or KPI tracking dashboards. This template elevates your process analysis presentations with professional polish and rapid adaptability.
Who is it for
Business analysts, process improvement specialists, operations managers, and project leads can leverage this cycle diagram to clearly articulate workflows, identify bottlenecks, and present optimization plans to stakeholders.
Other Uses
Beyond process analysis, repurpose this slide to illustrate project lifecycles, quality audit frameworks, change management roadmaps, organizational workflows, training modules, or KPI dashboards.
Login to download this file

Item ID
SB03561