


C Level Org Chart PowerPoint Template
Description
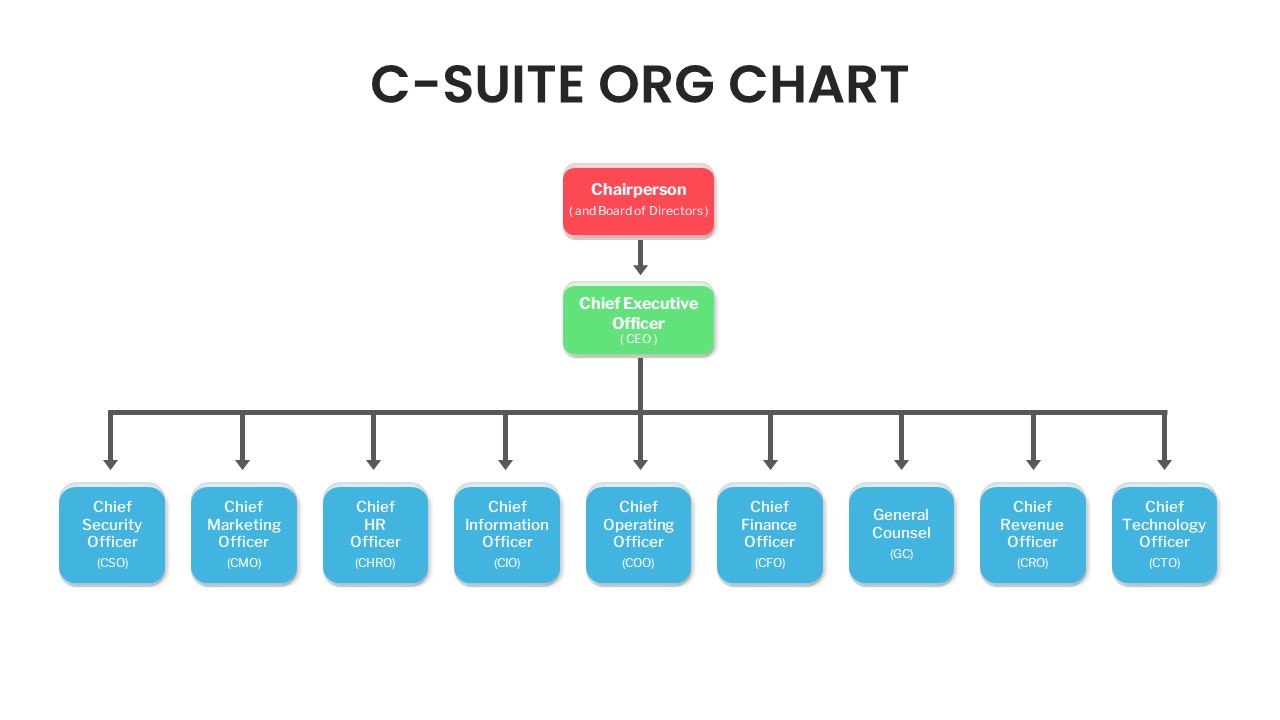
Use this C-Suite Org Chart slide to visually map your organization’s executive structure with clarity and color-coded hierarchy. At the top, a bold red panel represents the Chairperson and Board of Directors, linked via a clean gray arrow to a central green block denoting the Chief Executive Officer (CEO). Beneath, a horizontal array of nine uniform blue modules delineates key C-Suite roles—CSO, CMO, CHRO, CIO, COO, CFO, GC, CRO, and CTO—arranged for immediate comprehension of reporting lines. Each block features rounded corners, subtle drop shadows, and concise placeholder text ready for your titles and labels.
Designed on master slides, this template streamlines customization of colors, fonts, and element positioning. Swap shape fills to align with brand guidelines, adjust connector styles to reflect organizational nuances, or resize modules to emphasize priority roles. Use built-in placeholders to insert executive headshots, department icons, or supplemental notes without disrupting layout integrity. Responsive across PowerPoint and Google Slides, the slide preserves vector graphics and maintains consistent spacing across devices, eliminating formatting conflicts and version-control issues. Whether crafting a boardroom presentation, investor briefing, or annual report, this C-Suite Org Chart framework accelerates slide assembly and ensures a polished, professional look.
Beyond traditional organizational charts, this slide can adapt to map cross-functional teams, project leadership hierarchies, or advisory committees. Easily duplicate or remove modules to reflect interim roles, board subcommittees, or regional management structures. The clear node-and-connector design promotes quick audience understanding and can be repurposed for stakeholder matrices, governance frameworks, or training materials that require visualizing reporting relationships.
Who is it for
Corporate executives, board administrators, and HR or operations leaders can use this slide to present leadership structures and reporting lines. Consultants, management teams, and startup founders will also benefit from the clear visual mapping of their executive hierarchy and role definitions.
Other Uses
Repurpose this diagram to illustrate advisory boards, project steering committees, or regional management teams. The modular layout also supports visualizing functional department structures, stakeholder councils, or training program leadership frameworks.
Login to download this file
Add to favorites
Add to collection

Item ID
SB03482