


Bell Curve PowerPoint Template

Description
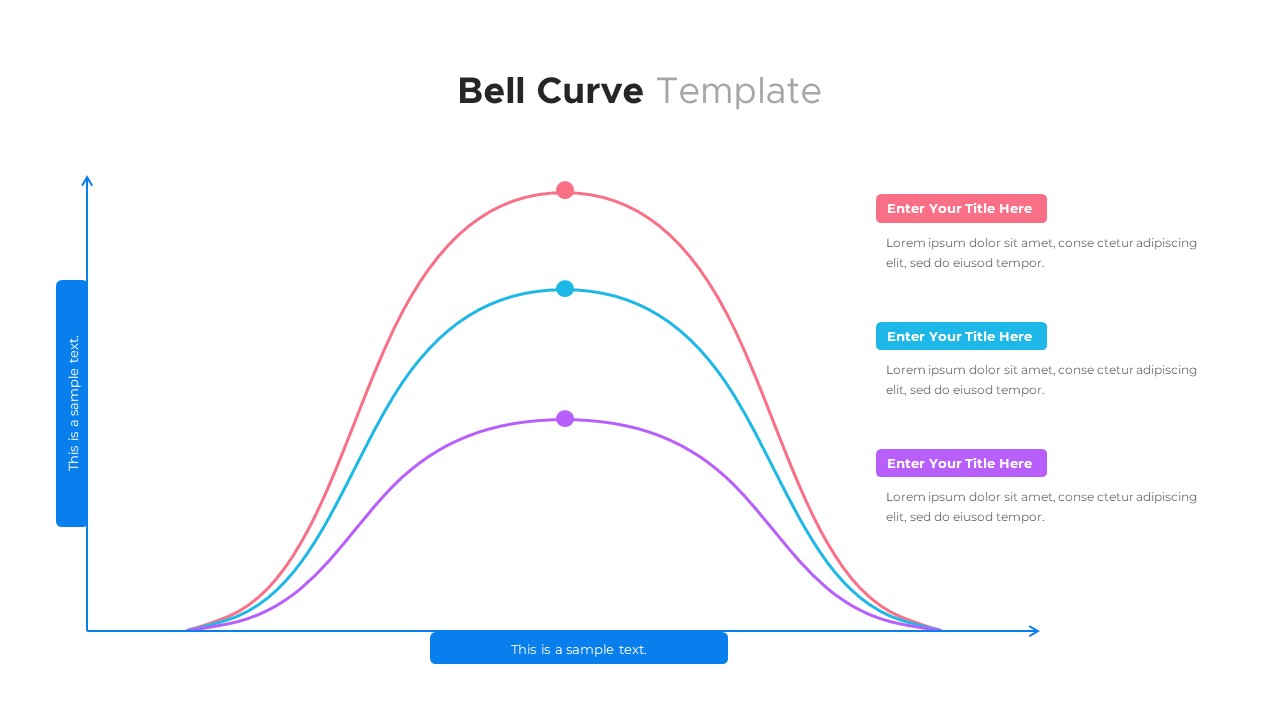
Leverage this comprehensive 8-variant Bell Curve infographic slide pack to convey distribution metrics with clarity and visual appeal. Each of the eight slides offers a unique design style—solid segments, gradient overlays, dark and light themes, multi-series comparisons, and customizable legends—empowering users to select the layout that best suits their data-storytelling needs. Prebuilt percentage labels, axis placeholders, and color-coded segments streamline the process of depicting key population slices, performance thresholds, or risk distributions at a glance.
Designed with editable master slides, this pack lets you swap colors, adjust segment counts, modify axis labels, and replace legends in seconds—all without disrupting the underlying layout. Whether you need a fuchsia-accented dark background, a minimalist white canvas with pastel segments, or a high-contrast presentation-ready variant, these slides maintain pixel-perfect fidelity across PowerPoint and Google Slides. Smart guides and layered objects ensure that you can reposition chart elements, resize containers, or update typographic styles effortlessly, reducing editing time and version-control headaches.
Each slide includes optional placeholder icons and arrow navigation cues that can link to additional drill-down slides or external resources. Built-in color themes, font sets, and animation presets allow you to craft professional-grade presentations that resonate with stakeholders.
Ideal for performance reviews, talent distribution analysis, quality assurance reporting, and educational workshops, this Bell Curve pack supports both quantitative and qualitative narratives. Use it to illustrate normal distributions in statistics classes, map employee performance against benchmarks, compare product adoption curves, or present customer satisfaction data. With eight distinct infographic approaches in one asset, you can adapt to diverse audience preferences, maintain brand consistency, and accelerate slide production. This versatile toolkit ensures your insights stand out, enabling data-driven storytelling with maximum impact and minimal effort.
Who is it for
Data analysts, human resource managers, and quality assurance teams will benefit from this pack when illustrating distribution metrics, performance thresholds, or risk assessments.
Other Uses
Repurpose these slides for educational workshops in statistics, employee performance benchmarking, product adoption curve comparisons, or customer satisfaction reporting.
Login to download this file

Item ID
SB03266