


6 Steps Circular Crm Diagram Powerpoint and Keynote 1

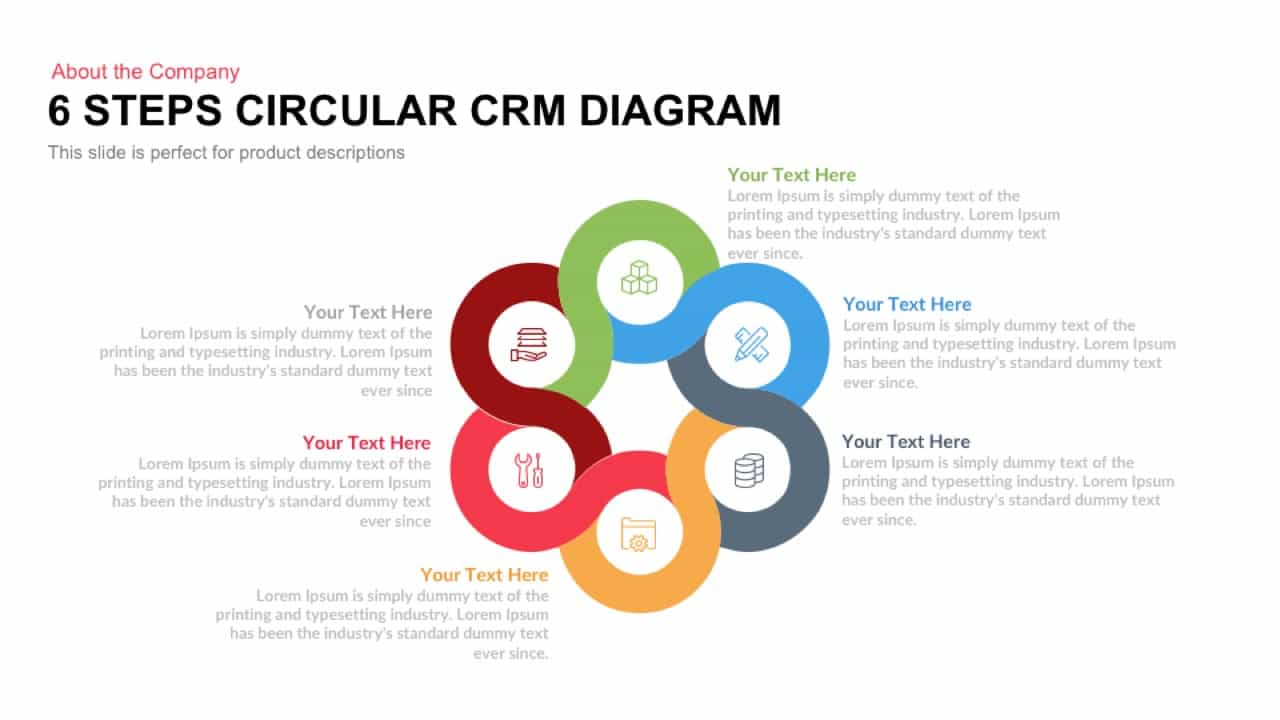
Transform your presentations with this six-step circular CRM diagram, optimized for illustrating the full spectrum of customer relationship management processes. The visually engaging design features six interlocking ring segments, each accented in vibrant flat colors—green, blue, gray, orange, red, and burgundy—to distinguish stages such as product components, design ideation, data management, documentation, maintenance, and reporting. Clean, minimalist icons reside at the center of each ring, ensuring instant recognition and reinforcing concept clarity. The continuous loop structure emphasizes process continuity and feedback loops, making it ideal for depicting customer acquisition, engagement, retention, and support strategies. Enhance engagement with animated transitions for each segment, apply custom icons to reflect your CRM metrics, and include data callouts to highlight key performance indicators. The modular vector framework ensures smooth transitions and precise alignment, empowering you to build narratives that scale seamlessly from high-level overviews to detailed technical analyses.
Built on fully editable vector shapes, this template allows you to effortlessly customize colors, swap icons, and adjust text placeholders to match your branding guidelines or thematic requirements. Leverage master slide functionality to maintain consistency across your deck and update visuals in seconds. Whether you need to present sales pipelines, onboarding workflows, service lifecycle frameworks, or marketing funnels, this circular diagram adapts to diverse contexts without sacrificing legibility or aesthetic appeal.
Compatible with both Microsoft PowerPoint and Google Slides, this asset guarantees high-resolution output and seamless cross-platform performance—no more formatting discrepancies or version-control headaches. With its strategic combination of bold color-coding and concise typography, audiences can quickly grasp complex sequences and relationships, driving engagement and facilitating data-driven discussions.
This six-step circular CRM diagram is perfect for stakeholder briefings, executive summaries, training sessions, and strategic workshops. Elevate your narrative by highlighting key performance indicators, illustrating cross-functional handoffs, or mapping customer touchpoints. Duplicate, rearrange, or repurpose segments to showcase team responsibilities, project milestones, or product lifecycles. Empower your team to communicate sophisticated processes with clarity and impact using this versatile infographic slide.
Who is it for
Sales directors, marketing managers, CRM specialists, and customer success teams looking to visualize end-to-end customer workflows will find this diagram invaluable. Business analysts, consultants, and project managers can also leverage its clear, circular layout to present process improvements and strategic roadmaps.
Other Uses
Beyond CRM applications, repurpose this diagram for mapping project lifecycles, illustrating marketing funnels, visualizing supply chain steps, or outlining IT system architectures. Resize and reassign icons to showcase support ticket pipelines, compliance audits, or performance dashboards, making this infographic suitable for diverse industries and presentation contexts.
Login to download this file
Add to favorites
Add to collection

Item ID
SB00191