


4 Level Infographic Shield PowerPoint Template
Description
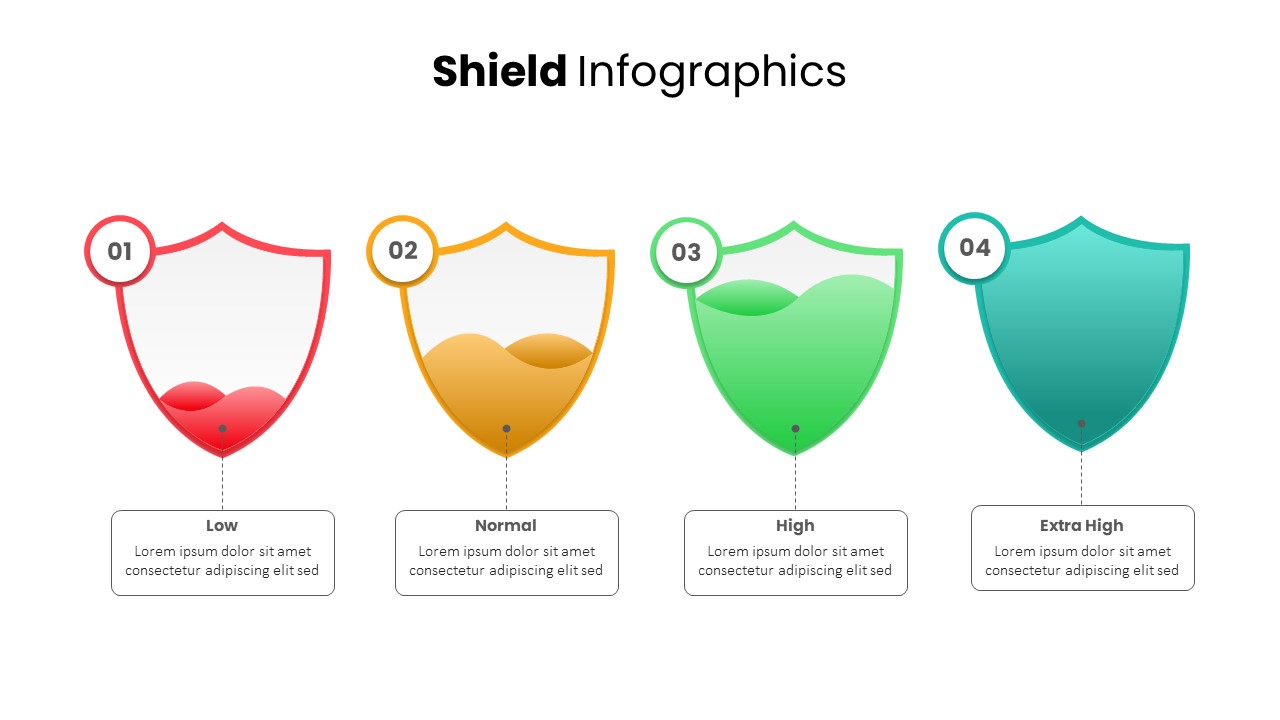
This shield infographic slide features four shield-shaped icons arranged horizontally, each with a numbered circle (01–04) and gradient fill levels representing Low, Normal, High, and Extra High intensity. The shields use distinct colors—red, orange, green, and teal—with semi-transparent overlays to visualize progressive fill heights. Below each shield, a dashed line connects to labeled text boxes for clear annotations, ideal for describing risk thresholds, performance tiers, or security statuses. The clean white background and minimal outline design ensure the colored shields stand out, while consistent typography maintains readability across all levels.
The template includes editable master slides that allow you to adjust colors, replace icons, swap text placeholders, and modify level labels without compromising layout integrity. Simply update the numbered circles, gradient stops, or text content to align with your branding or project requirements. The slide’s balanced composition guides viewer focus from the leftmost Low level through to the Extra High stage on the right, fostering intuitive comprehension of sequential or hierarchical data.
Crafted for both PowerPoint and Google Slides, this infographic retains full-resolution sharpness and supports collaborative editing. Use it to present risk assessments, security postures, performance indicators, or progress milestones in workshops, board meetings, or training sessions. The shield motif conveys protection and reliability, making it suitable for topics around cybersecurity, quality assurance, compliance reporting, and strategic planning. With straightforward customization and a visually engaging format, this slide accelerates content creation and enhances audience engagement.
Advanced users can customize the pin markers beneath each shield to display custom icons or adjust connector line styles, enabling deeper data visualization and thematic consistency across deck slides.
Who is it for
Risk managers, cybersecurity teams, and compliance officers will find this slide invaluable for illustrating security postures and threat levels. Project leaders, quality assurance specialists, and performance analysts can leverage the clear level indicators to benchmark metrics and guide strategic decisions.
Other Uses
Beyond risk visualization, repurpose this infographic to display customer satisfaction tiers, resource allocation priorities, or product quality grades. The shield icons also work well for security audits, vulnerability assessments, or milestone progress tracking in corporate and educational presentations.
Login to download this file
Add to favorites
Add to collection

Item ID
SB03503