Big Data Infographic Deck PowerPoint Template

Description
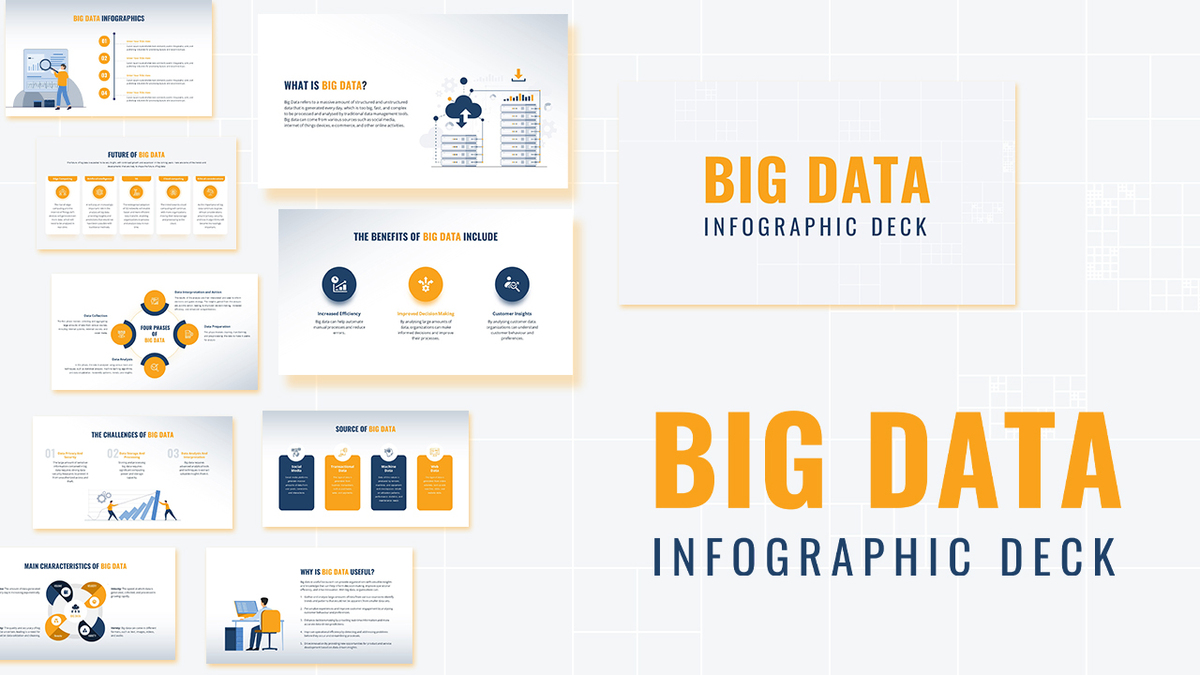
Drive data-driven presentations with this comprehensive Big Data Infographic Deck template for PowerPoint & Google Slides. Featuring a clean white grid background and a bold two-tone palette of navy and yellow, this 17-slide deck covers every aspect of Big Data with professional infographic layouts. Begin with a grid-textured cover slide displaying “Big Data Infographic Deck” in large yellow and blue typography. Follow up with a “What Is Big Data?” slide that pairs a concise definition with a cloud-and-server illustration.
Explore the core characteristics of Big Data through a circular 4-Vs diagram (Volume, Velocity, Variety, Veracity) rendered in alternating segments. Highlight key benefits—improved decision-making, operational efficiency, and customer insights—using icon-anchored callouts. Illustrate challenges like data privacy, storage demands, and analysis complexity with numbered headlines and engaging visuals. Compare Small Data vs. Big Data side by side with contrasting blocks that emphasize scope, structure, and processing needs.
Delve into data sources with segmented panels for social media, transactional, machine, and web datasets. Outline strategic value in a multipoint “Why Is Big Data Useful?” slide paired with a workstation illustration. Showcase market forecasts via bar charts, map four phases of data analytics in a circular flowchart, and use vertical timelines to visualize future trends.
Designed for effortless customization, all icons, colors, and text placeholders are fully editable via the master slide. Swap illustrations, adjust hues to match your brand palette, or extend layouts to deliver impactful workshops, boardroom briefings, or academic lectures. Compatible with both PowerPoint & Google Slides, this Big Data Infographic Deck accelerates your storytelling and positions complex information with clarity and flair.
Who is it for
Data analysts, IT professionals, and business managers will benefit from this infographic deck when presenting technical workshops, executive reports, or academic lectures on Big Data principles. Marketing teams and consultants can leverage the clear layouts to communicate insights and drive data-led strategies.
Other Uses
Beyond Big Data education, repurpose these infographics for IoT analytics overviews, market research presentations, project phase roadmaps, or technology trend reports. Adapt the circular and timeline diagrams for process flows, product roadmaps, or quarterly performance reviews.
Login to download this file


