


Nine Circle Network Diagram Powerpoint Keynote 1
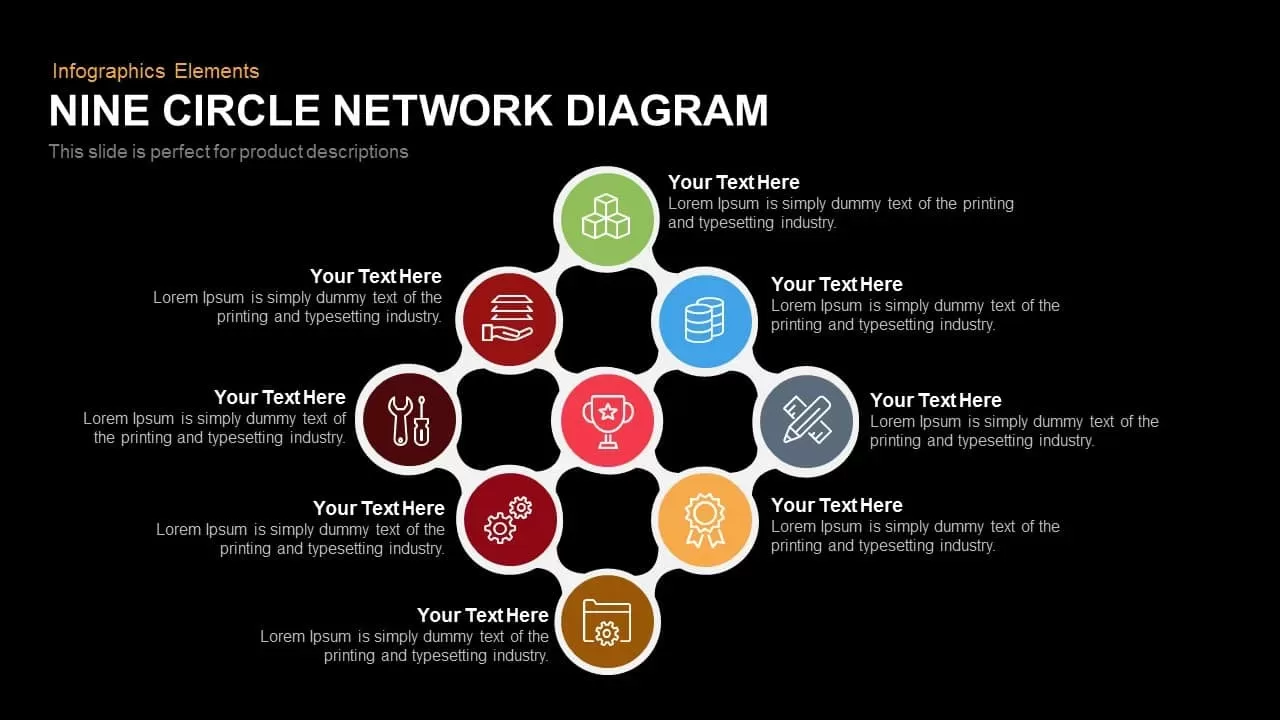
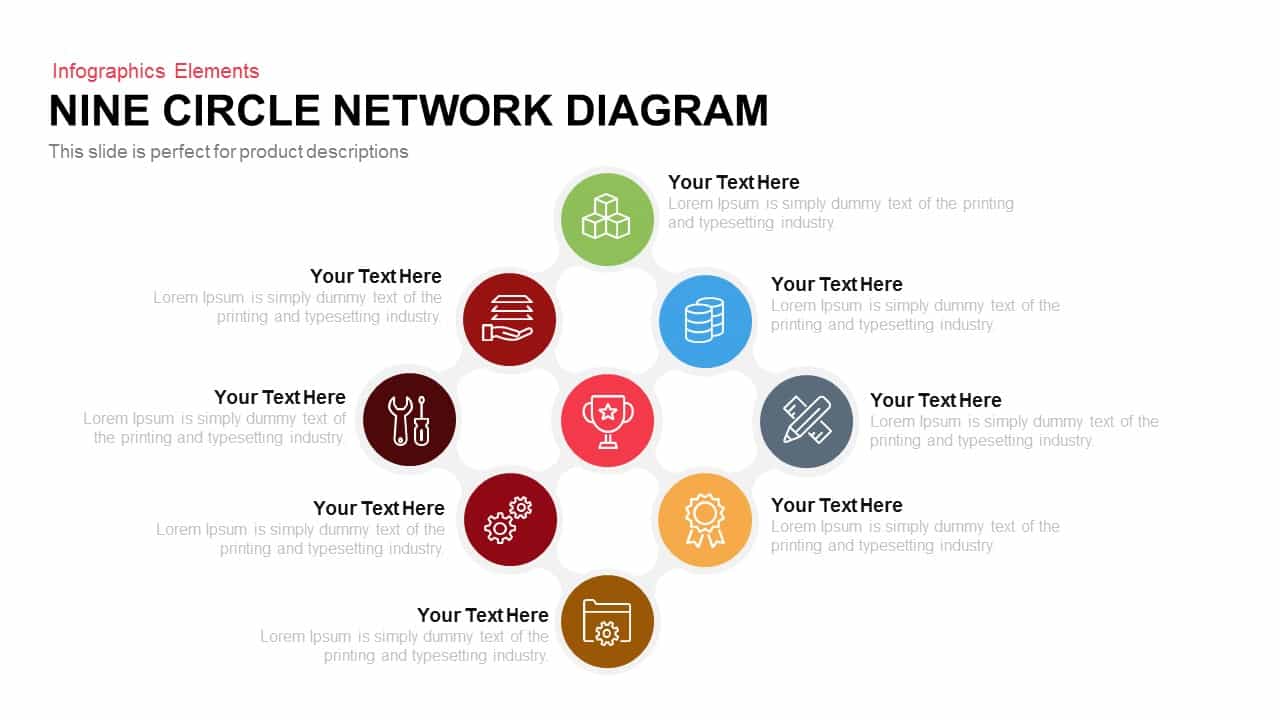
Leverage this versatile nine-circle network diagram to illustrate complex relationships or workflows across interconnected nodes with clarity and style. Featuring a central trophy icon at the heart of the design, eight peripheral nodes allow you to map stakeholders, processes, system components, or strategic pillars around a core objective. Each circle hosts a customizable icon and headline, accompanied by a brief description placeholder to add context, metrics, or action items. The clean flat design employs vibrant, contrast-rich circles against a minimalist white background, ensuring your audience’s focus remains on the content. Subtle drop shadows and consistent typography deliver a polished, professional look compatible with modern corporate branding.
Built on master slides, this asset ensures quick customization: swap icons, adjust colors, resize shapes, and update text in seconds without breaking layout integrity. The slide’s vector-based graphics guarantee crisp rendering on any display size, whether in print, on large screens, or during remote conferencing. Optimize stakeholder alignment by using this diagram to highlight resource allocation, project dependencies, risk factors, or performance metrics in boardroom presentations, training sessions, or client proposals.
Its hub-and-spoke configuration reinforces central themes such as core values, flagship products, or strategic goals while showing how each element connects back to the main objective. Ideal for visualizing ecosystems, organizational structures, technology stacks, or market segments, this diagram fosters intuitive understanding and sparks meaningful discussion. Adapt the layout by duplicating nodes, repositioning circles, or changing iconography to suit use cases like supply chain mapping, customer journey analysis, risk assessments, or departmental overviews. With universal compatibility and easy-to-edit placeholders, this nine-circle network diagram helps you communicate complex information with maximum impact and minimal effort.
Whether you are a consultant presenting a market ecosystem, a product manager outlining feature dependencies, or a team lead summarizing project milestones, this diagram adapts to any professional scenario. Use it to compare competitive offerings, show data flows between modules, or track progress across multiple workstreams. This versatile slide streamlines slide creation, reduces manual formatting, and elevates the visual impact of your presentations.
Who is it for
Consultants, product managers, project leads, business analysts, marketing teams, technology architects, and operations managers will benefit from this diagram when visualizing interconnected elements, stakeholder roles, or system architectures.
Other Uses
Apply this network layout to supply chain mapping, customer journey breakdowns, organizational structure overviews, technology stack diagrams, market segmentation visuals, or risk assessment frameworks.
Login to download this file
Add to favorites
Add to collection

Item ID
SB00170