


Magnifying Glass With Arrows Infographics
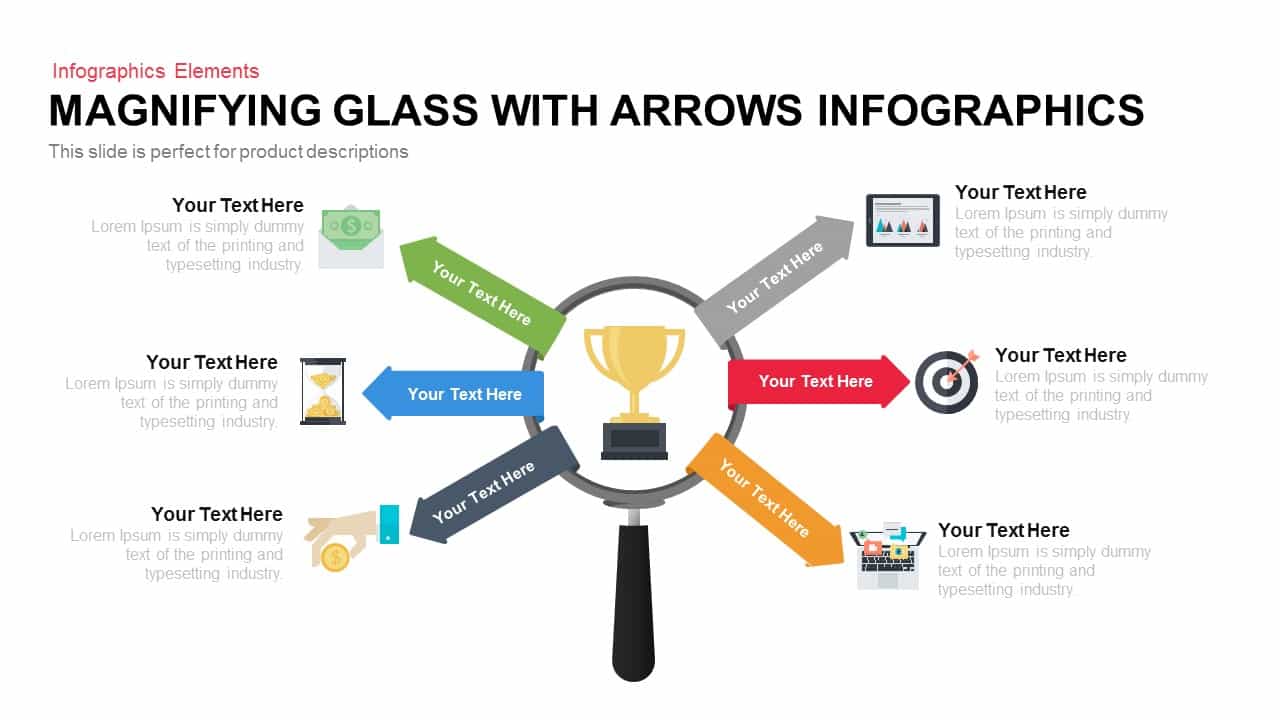
Leverage this dynamic magnifying glass infographic slide to spotlight your organization’s key achievement drivers with clarity and visual appeal. Centered around a magnifying glass revealing a trophy icon, six vibrant radial arrows extend outward—each arrow accented with a distinct color and custom icon placeholder—to represent critical factors, milestones, or strategic pillars that converge on your core success metric. The modern flat design features crisp typography, intuitive placeholders, and layered shadows for depth, ensuring seamless integration with corporate branding and tone. With easy-to-edit shapes, color-coded arrows, and master-slide compatibility, this asset streamlines customization, letting you swap icons, adjust hues, or reorient arrows in seconds without design expertise.
Engineered for cross-platform consistency, this slide maintains full-resolution integrity across both PowerPoint and Google Slides, eliminating layout shifts and version-control hassles. Ideal for product descriptions, performance reviews, roadmap presentations, or strategic workshops, the radial layout facilitates logical storytelling by visually connecting each element back to your central objective. Whether you’re mapping out project milestones, highlighting sales KPIs, or outlining operational processes, this versatile graphic empowers you to communicate complex insights with maximum impact and minimal effort.
This infographic template harnesses master slides, vector-based assets, and editable text blocks to accelerate your workflow. Simply drag and drop your icons into the designated placeholders, tweak arrow orientations, or swap color palettes to align with your brand guidelines. The balanced six-spoke arrangement fosters audience focus, making it easier to compare and prioritize elements. Whether you’re prepping an investor pitch, department briefing, or training module, this slide delivers professional aesthetics and straightforward editing—no graphic design skills necessary.
Who is it for
Marketing leaders, product managers, project leads, consultants, and business analysts seeking to break down success factors, milestones, or strategic priorities in a visually engaging radial format will benefit from this infographic slide.
Other Uses
Apart from spotlighting achievement drivers, this slide can be repurposed for process mapping, project milestone roadmaps, KPI presentations, team role breakdowns, risk assessments, feature comparisons, training agendas, or client proposal visuals by updating icons, colors, and text.
Login to download this file

Item ID
SB00169