


Digital Marketing ROI Template
Description
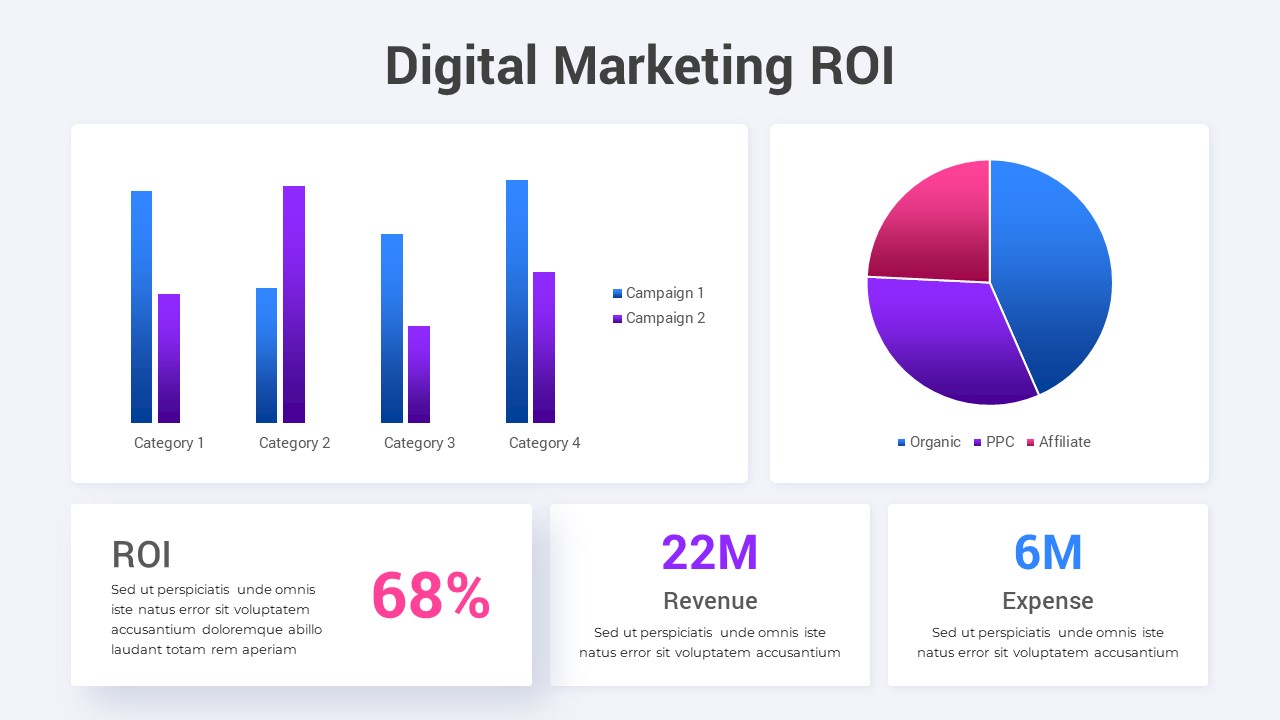
This "Digital Marketing ROI" slide offers a visually appealing and informative way to present key performance data for digital marketing campaigns. The slide includes two bar charts that compare Campaign 1 and Campaign 2 across four categories, highlighting performance variations over time. To complement this, a pie chart illustrates the ROI distribution between Organic, PPC, and Affiliate channels, giving a clear picture of the marketing strategy's effectiveness.
The slide also features essential metrics such as ROI (68%), revenue (22M), and expenses (6M), displayed in bold and colorful text boxes to make key numbers stand out. The use of purple and blue tones enhances the clarity and emphasis on data, creating a professional and eye-catching layout. This slide is perfect for presenting digital marketing results, assessing campaign performance, or reviewing financial outcomes in a visually engaging way.
Fully customizable for your specific data, this template works seamlessly in both PowerPoint and Google Slides, enabling easy updates to text, graphs, and colors. Whether for client meetings, internal reviews, or strategic planning sessions, this slide helps convey digital marketing performance metrics effectively.
Who is it for
This template is ideal for digital marketers, marketing managers, analysts, and business executives looking to present marketing performance data. It’s especially useful for presenting to clients, stakeholders, or team members about the success of digital campaigns.
Other Uses
Beyond marketing analysis, this slide can be adapted for presenting project outcomes, sales performance, budget breakdowns, or any situation where a combination of charts and key financial metrics needs to be displayed clearly.
Login to download this file
Add to favorites
Add to collection

Item ID
SB03229