


ROI Presentation Dark
Description
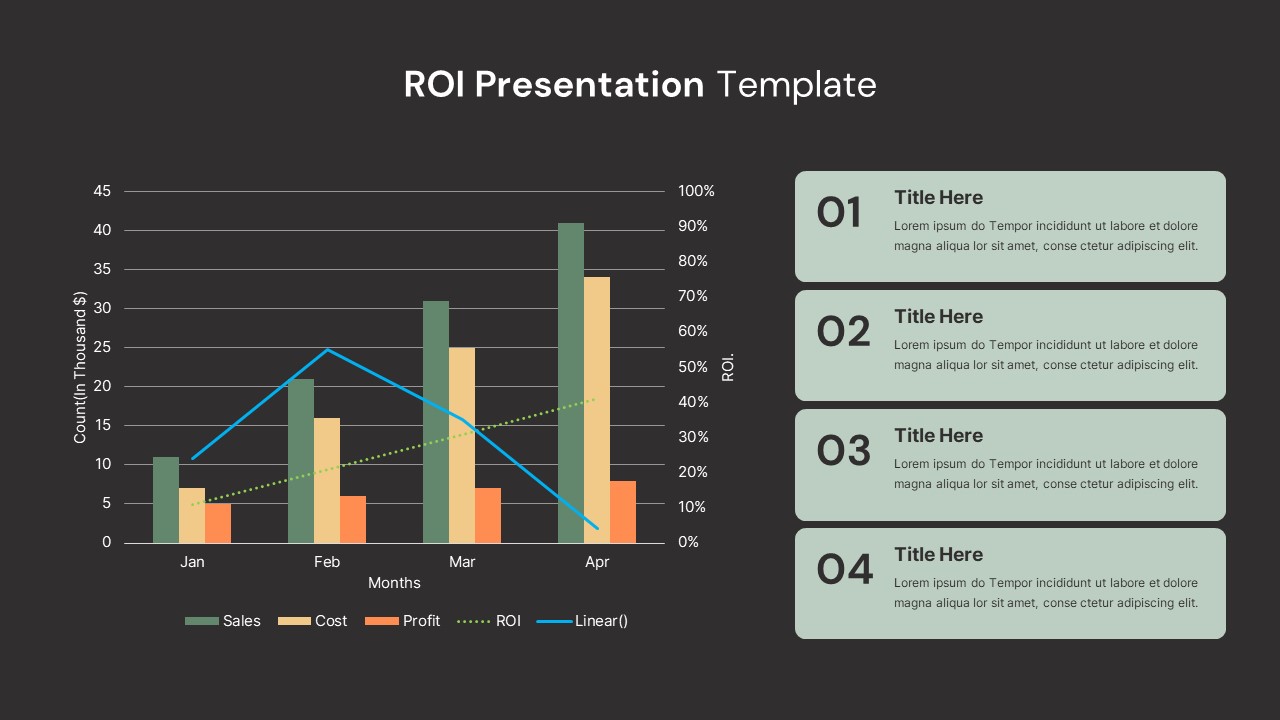
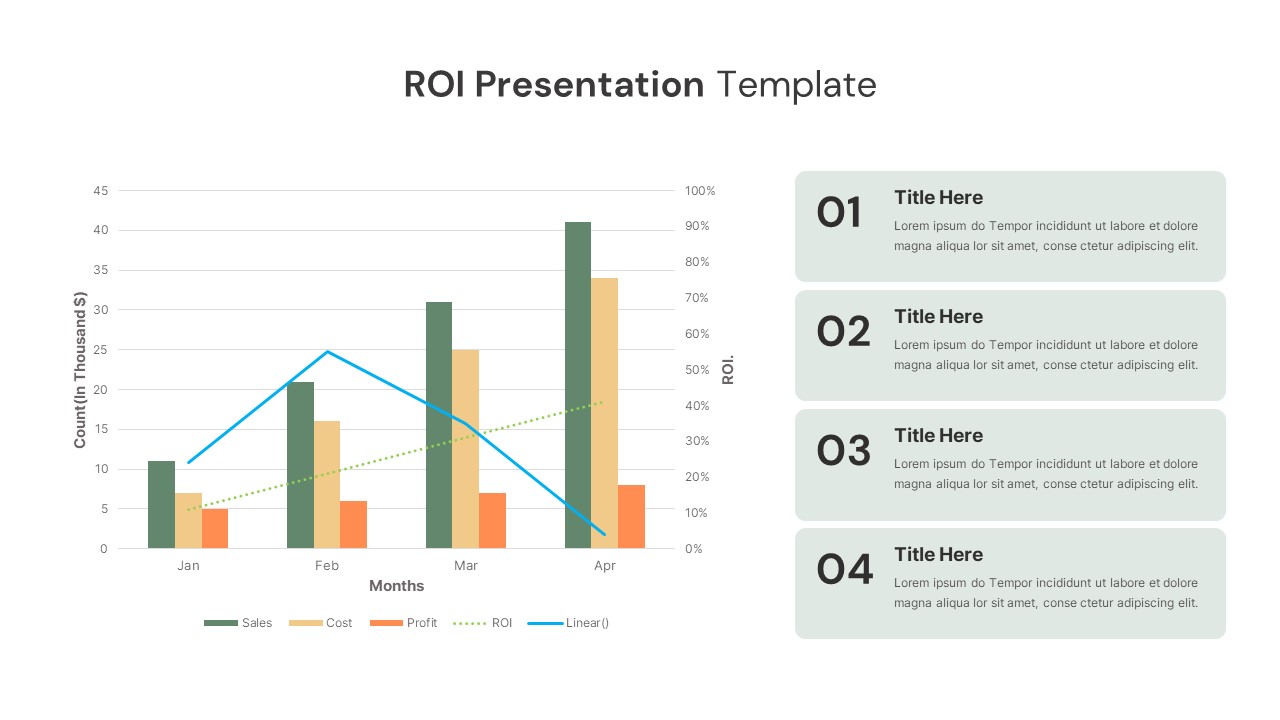
The "ROI Presentation" slide is a comprehensive tool designed to visualize the Return on Investment (ROI) of various projects or products over time. It showcases the relationship between Sales, Costs, and Profit across different months, with an integrated line chart to highlight ROI trends. The clear layout makes it easy to compare the financial data, helping audiences quickly grasp insights into profitability, cost management, and overall performance.
In this slide, Sales, Costs, and Profit are represented with colored bar graphs, while the ROI is displayed through a percentage line graph for each month. The inclusion of a linear progression line gives additional context, helping to visualize any upward or downward trends in ROI. This dynamic tool is ideal for presenting financial results, business performance reviews, or investment analysis in meetings, reports, or pitches.
The clean design ensures clarity in data representation, making it effective for executives, business analysts, and managers who need to convey complex financial information in a straightforward, accessible manner.
Who is it for
Business professionals, financial analysts, and managers who need to present ROI data. Ideal for team leaders, project managers, and stakeholders involved in evaluating and improving business profitability or project performance over time.
Other Uses
This slide can be repurposed for use in sales reports, cost-benefit analyses, or project progress tracking. It’s also useful for marketing teams measuring campaign ROI or product teams evaluating product launch outcomes.
Login to download this file

Item ID
SB03195