


Flat Organizational Chart Template
Description
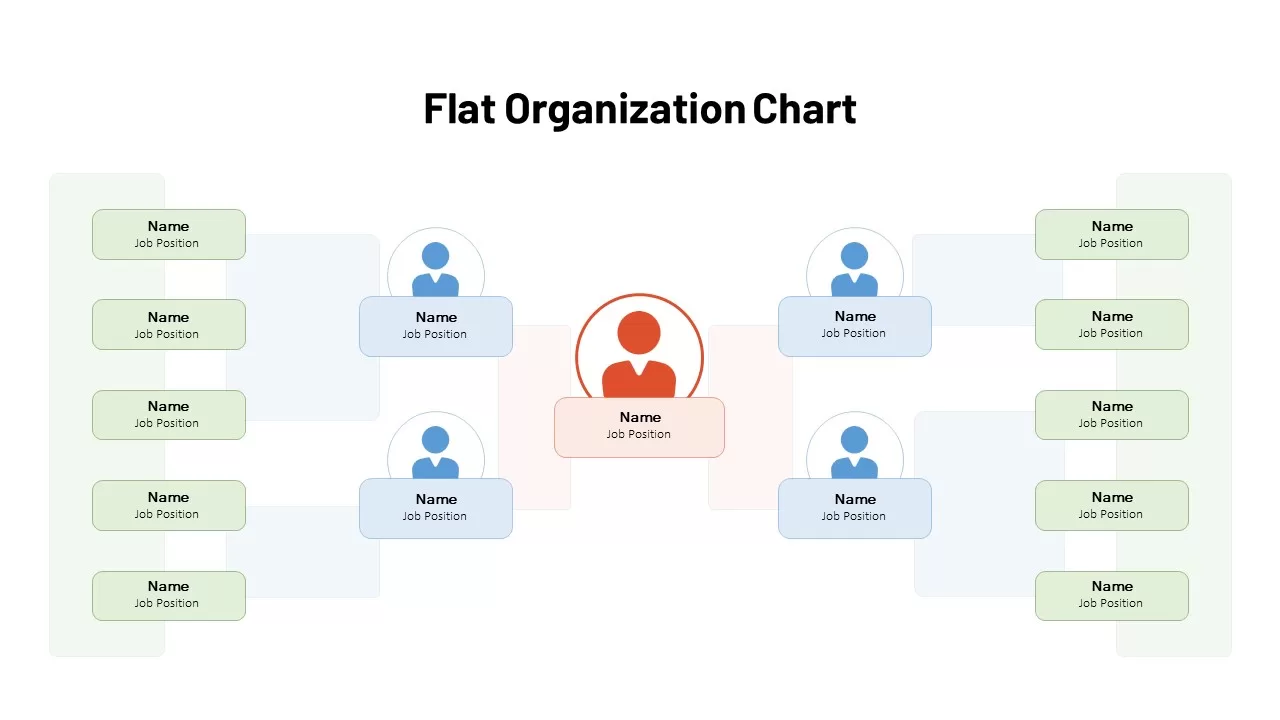
Communicate your team’s structure with this clear, flat organization chart slide. A central red node anchors the hierarchy, representing the primary leader, and connects via precise lines to two light-blue manager nodes on either side. Each manager node then branches out to three pastel-green team nodes, creating a balanced, two-tier distribution of roles. The minimalist design employs rounded rectangles, consistent line weights, and subtle shadows for depth, ensuring your chart remains professional and uncluttered.
Built on editable master slides, this template allows you to rename each role, adjust branch counts, and swap colors to match your corporate branding in seconds. The flat layout ensures every node stays visible and legible, even when printed or projected in large settings. Use connector animations to reveal each level sequentially during live presentations, guiding audience focus and reinforcing your narrative. Whether you’re outlining departmental responsibilities, visualizing project teams, or presenting new reporting lines, this slide adapts seamlessly: duplicate the chart for multiple divisions, reorder nodes for alternative structures, or integrate your company logo into the central hub.
Because it’s optimized for both PowerPoint and Google Slides, you can update content collaboratively without formatting issues. Placeholder text and ready-made styles reduce design friction—simply replace names and positions, apply your font choices, and customize the color palette to deliver an on-brand chart in minutes. The flat aesthetic also makes it easy to export as a handout or poster for office displays, training materials, or stakeholder briefings. With its balanced composition and intuitive editing controls, this flat organization chart template streamlines the creation of polished, data-driven presentations that resonate with executives, HR teams, and project stakeholders alike.
Who is it for
HR professionals, team leads, project managers, and executives who need a straightforward, visually engaging way to illustrate reporting lines and departmental structures.
Other Uses
Repurpose as a project-team breakdown, RACI responsibility matrix, regional management chart, or product-line hierarchy by relabeling nodes and adjusting branch counts to fit any organizational mapping scenario.
Login to download this file

Item ID
SB03076