


Heatmap Template for Presentation Dark

Description
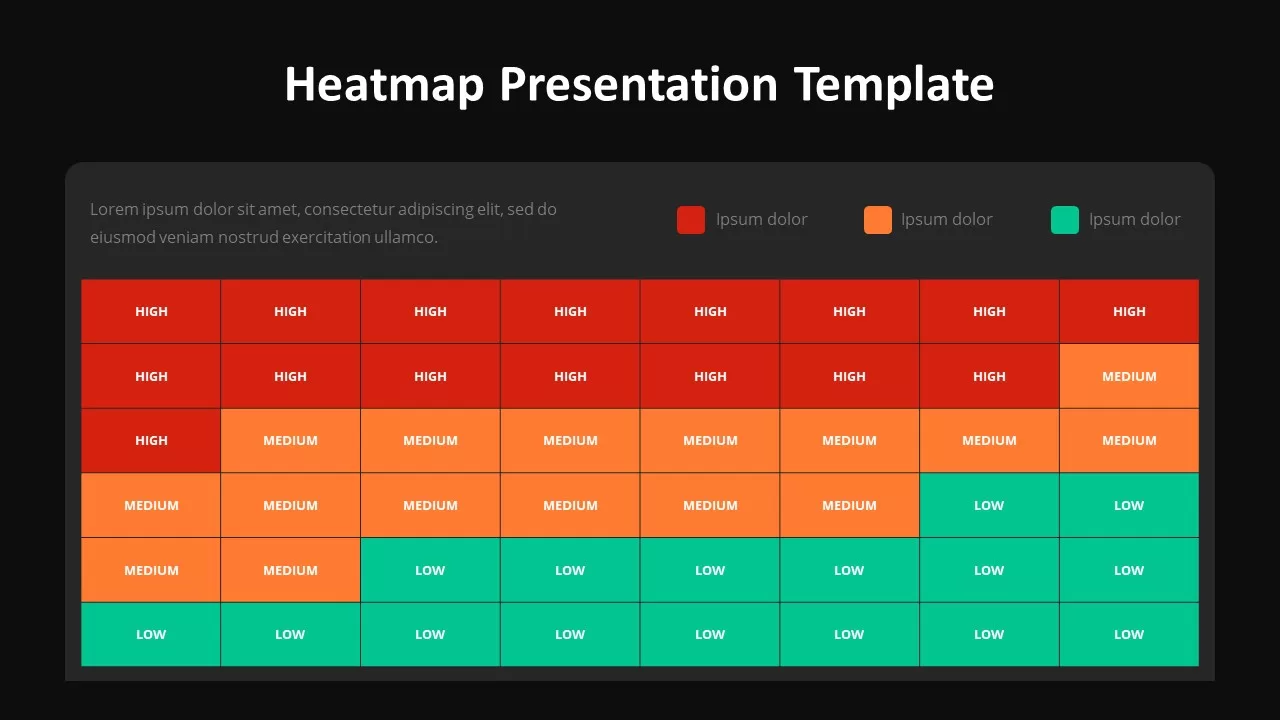
Leverage this dynamic heatmap slide to visualize and compare data intensity across multiple categories at a glance. The grid layout features six rows and eight columns of color-coded cells—red for high values, orange for medium, and green for low—allowing viewers to instantly identify trends, outliers, and performance clusters. A clean legend above the matrix clarifies color meanings, while a brief header space lets you introduce context or summarize findings. Each cell carries a bold, white label (“HIGH,” “MEDIUM,” or “LOW”) for immediate readability against contrasting backgrounds.
Designed on master slides, this template offers full customization: adjust the number of rows or columns to fit your dataset, swap colors to match corporate branding, and edit labels or axis titles to suit your analysis. Rounded corners, subtle drop shadows, and ample white space create a modern, uncluttered aesthetic that keeps focus on your insights. Whether you’re presenting sales performance by region, customer satisfaction heatmaps, risk-assessment matrices, or resource allocation charts, this slide scales effortlessly—duplicate the layout for multi-period comparisons, overlay data markers for emphasis, or animate cell fills to guide audience attention during live presentations.
Optimized for both PowerPoint and Google Slides, this asset ensures pixel-perfect rendering across devices and platforms. Built-in placeholders and consistent styling streamline deck production, reducing formatting headaches and version-control issues. Simply drag and drop your data visual, tweak labels, and apply animations to deliver a compelling, data-driven story that resonates with stakeholders, executives, and team members alike.
Who is it for
Business analysts, marketing managers, project leads, data scientists, and consultants who need to highlight comparative metrics, performance trends, or risk levels in a clear, visually engaging format.
Other Uses
Adapt this layout for site-heatmap overlays, resource utilization matrices, competitor benchmarking grids, employee performance ratings, process-efficiency assessments, or customer-journey analyses to amplify insights and drive data-informed decisions.
Login to download this file
Add to favorites
Add to collection

Item ID
SB03058