


Project Status Infographics Dark

Description
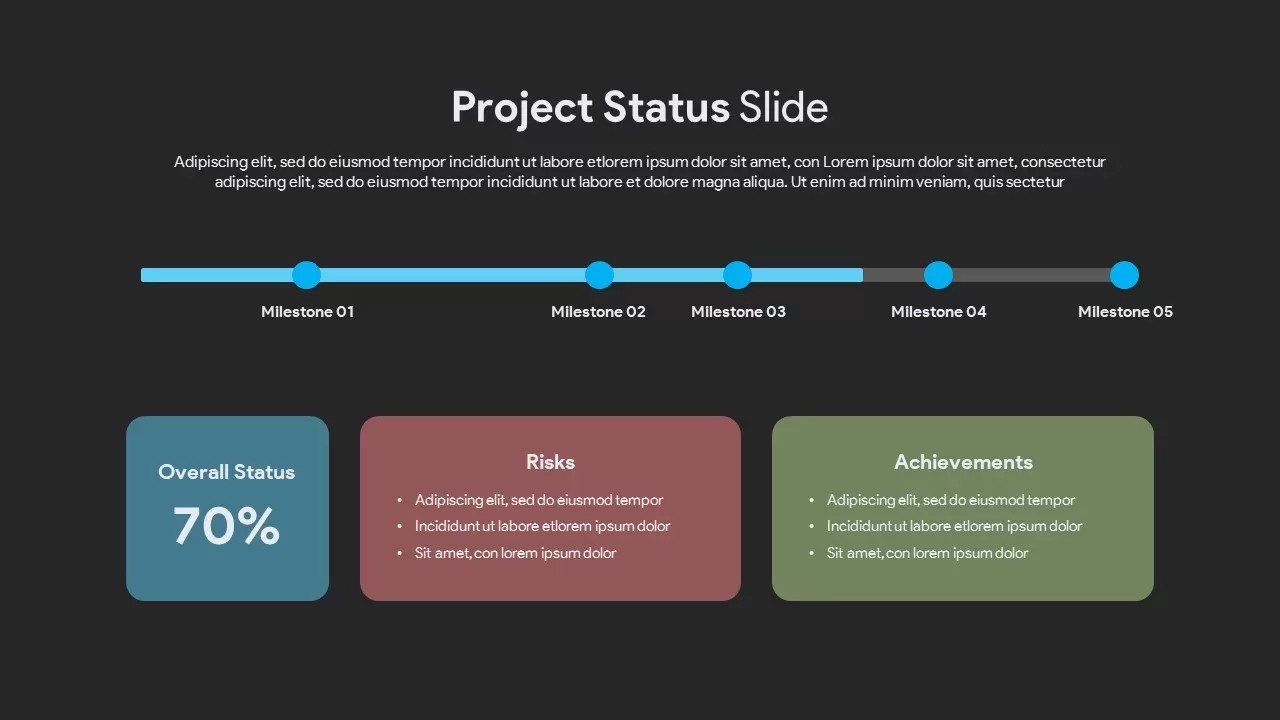
This slide combines a horizontal milestone timeline with a structured status dashboard for PowerPoint & Google Slides. Up top, five evenly spaced blue connector lines and circular markers denote project milestones—each labeled below for clear sequencing. Beneath, three color-coded panels summarize critical data: a light blue block for overall completion percentage, a pink block listing key risks in bullet form, and a green block highlighting achievements. Subtle drop shadows and minimalist typography ensure readability, while the grey background keeps focus on your metrics. Built on master slides with editable vector shapes, you can adjust colors, swap icons, change milestone labels, and update percentages in seconds. Optional fade-in animations let you reveal each milestone and panel sequentially, maintaining audience engagement and reinforcing your narrative flow.
Who is it for
Ideal for project managers, program directors, and PMO teams delivering status updates to executives and stakeholders. Agile coaches and scrum masters can use it for sprint retrospectives, while consultants and analysts may leverage the layout for client progress reports and risk assessments.
Other Uses
Repurpose this template for quarterly reviews, product launch timelines, or event planning milestones. Adapt the panels to display budget burn-rate, resource allocation, or customer feedback summaries. Duplicate the layout to compare parallel initiatives or track multi-team deliverables across phases.
Login to download this file
Add to favorites
Add to collection

Item ID
SB03000