


PowerPoint Project Status Template Dark
Description
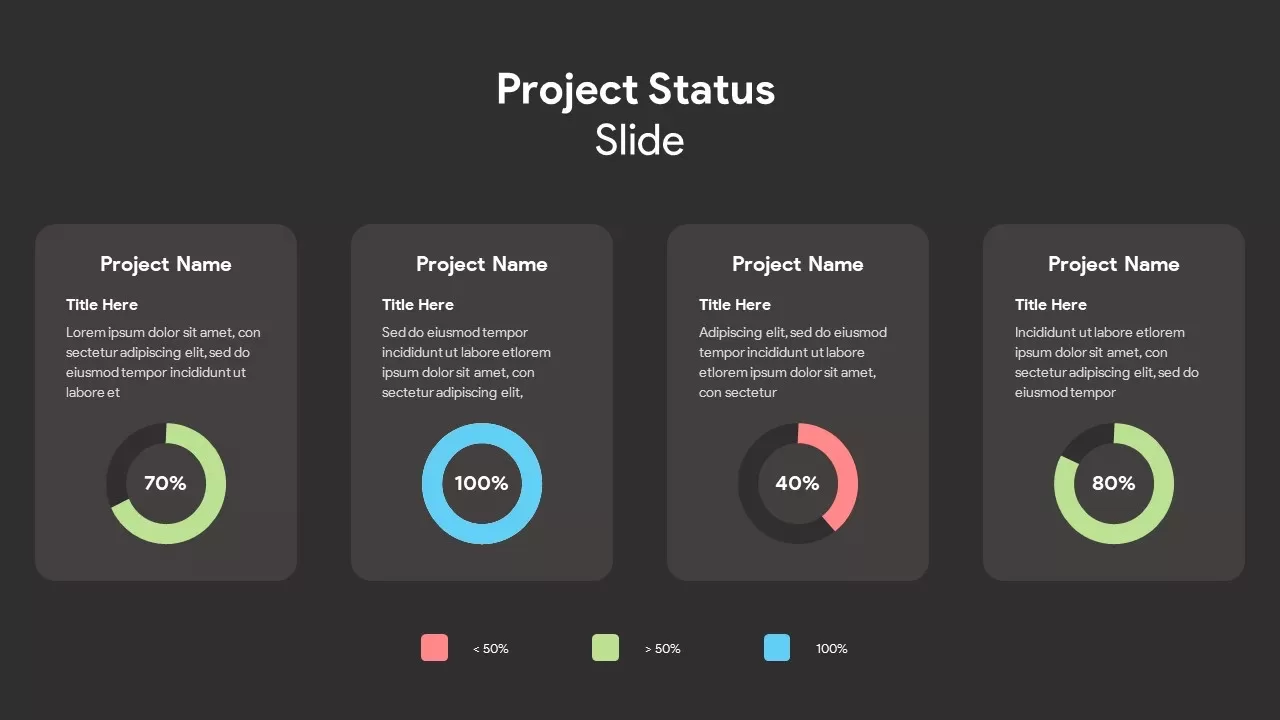
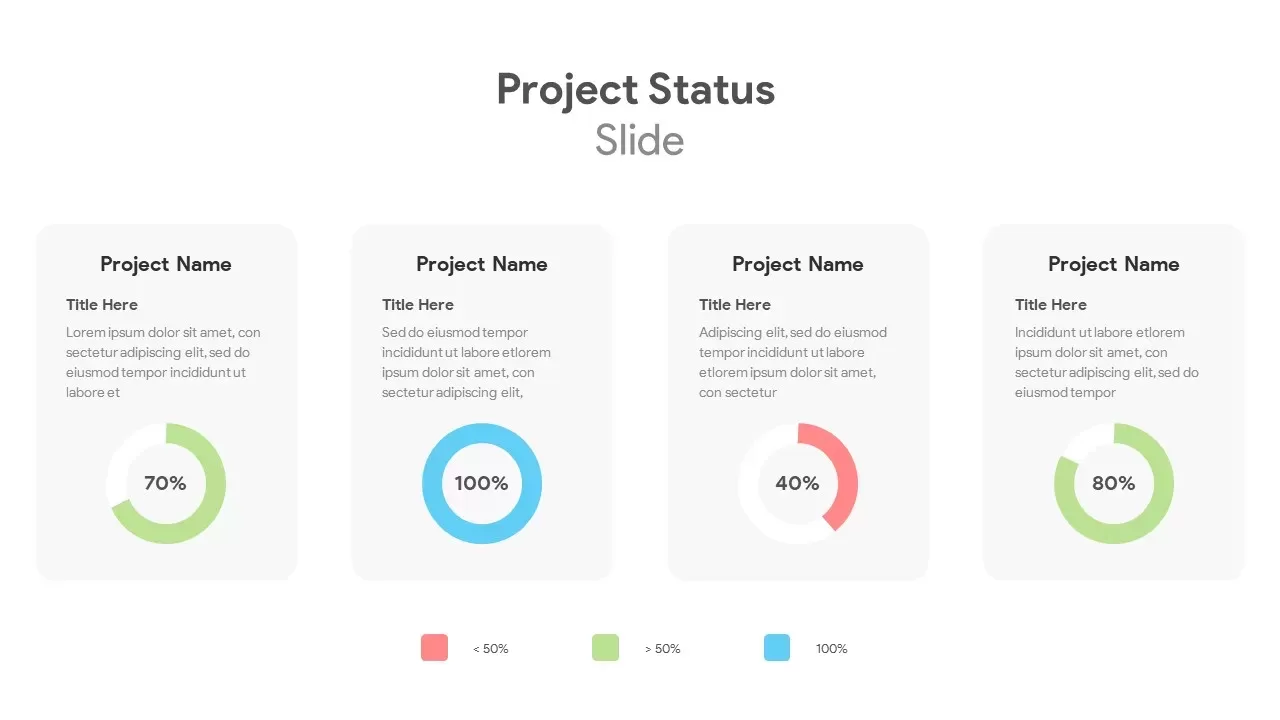
Leverage this circular project status dashboard slide to display progress metrics with clarity and visual appeal. Four equally sized cards feature large, flat circular progress indicators—color-coded red for < 50 %, green for > 50 %, and blue for 100 %—paired with project titles, subtitles, and description text. A concise legend beneath the cards explains the color thresholds, ensuring audiences instantly grasp each project’s health at a glance. The clean white background, subtle drop shadows, and consistent typography deliver a modern, professional aesthetic that adapts seamlessly to any corporate branding.
Built for both PowerPoint and Google Slides, this template offers fully editable vector shapes, intuitive drag-and-drop text and image placeholders, and master-slide support for rapid customization. Adjust circle sizes, swap in icons, or modify percentage values in seconds to reflect your data. The modular card layout allows you to duplicate, remove, or reorder sections to accommodate different numbers of projects without disrupting overall design integrity. Integrated theme settings maintain uniform fonts and colors across multi-slide decks, streamlining collaboration and reducing version-control headaches.
Ideal for weekly status reports, stakeholder briefings, or portfolio overviews, this dashboard slide empowers presenters to focus on insights rather than formatting. By combining concise text areas with bold visual indicators, you can drive data-driven discussions, highlight risks, and celebrate milestones—all within a single, easy-to-interpret layout.
Who is it for
Project managers, PMO teams, and portfolio directors will find this slide essential for reporting on project health, progress tracking, and resource allocation. Executives and stakeholders gain clear visibility into status metrics, enabling faster, informed decision-making.
Other Uses
Repurpose this design for KPI tracking, performance dashboards, sales target overviews, or any scenario requiring at-a-glance progress visualization. Simply relabel circles and adjust color thresholds to fit your metrics framework.
Login to download this file
Add to favorites
Add to collection

Item ID
SB02998