


Project Status Slide
Description
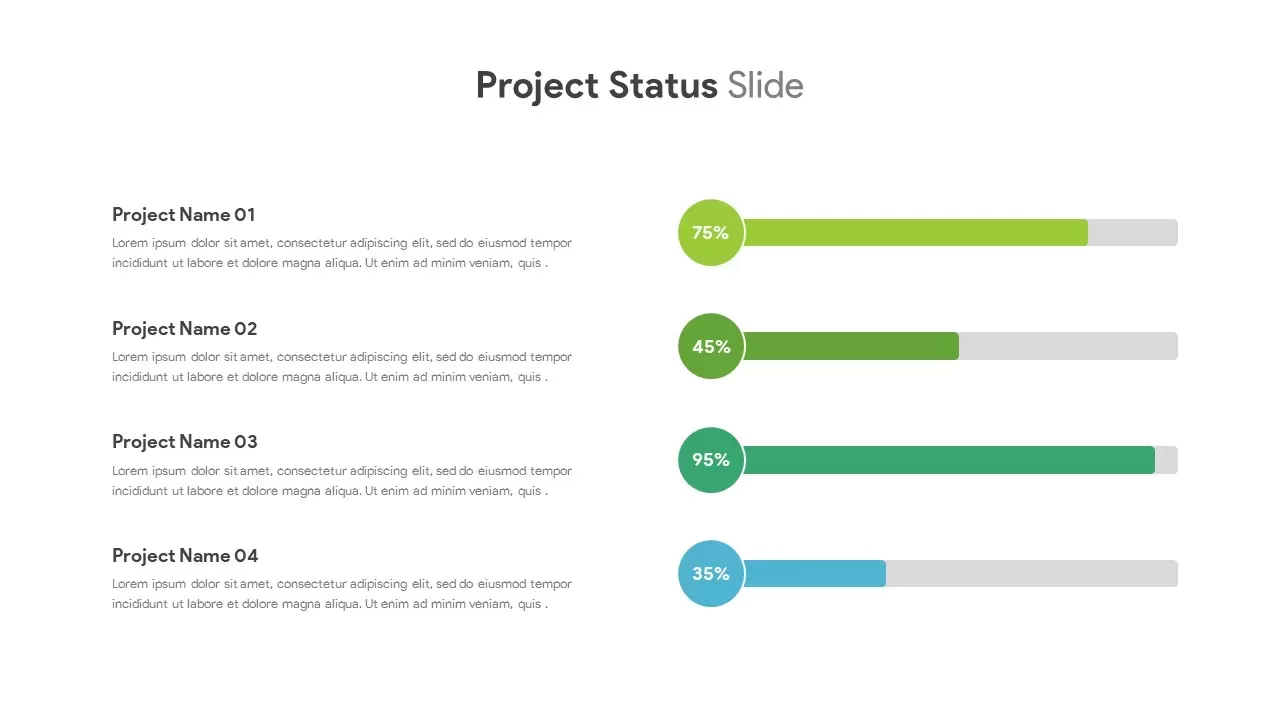
Showcase project progress at a glance with this Color-Coded Project Status Slide Template—perfect for PowerPoint & Google Slides. The slide splits into two distinct sections: on the left, four text blocks titled Project Name 01 through Project Name 04 support concise descriptions of each initiative, while on the right, matching progress indicators visualize completion percentages. Each indicator comprises a colored circular badge with a bold numeric label and a horizontal progress bar extending to reflect real-time status. Greyed-out bar sections convey remaining work, ensuring viewers grasp the data instantly.
Engineered for simplicity and efficiency, this template is built on master slides and leverages layered, fully editable vector shapes. Adjust brand colors, swap out project names, and update percentages in seconds—no manual alignments are needed. The progress circles and bars can be recolored to match corporate palettes, and the placeholder text supports uniform typography across your deck. Export and animate shapes sequentially to reveal each project’s status one at a time, helping presenters maintain audience focus and narrative flow.
Designed with clarity in mind, a clean white background and minimalist sans-serif fonts deliver maximum readability, while consistent spacing and alignment guide stakeholder attention. This slide adapts seamlessly to widescreen (16:9) and standard (4:3) formats, making it ideal for live presentations, virtual webinars, and printed reports. Whether you’re leading executive briefings, agile sprint reviews, or client-facing updates, this Color-Coded Project Status Slide ensures critical program metrics are communicated effectively and professionally. Duplicate and customize the layout for additional projects or extended timelines, turning your data into compelling, easy-to-follow visuals.
Who is it for
Project managers, program directors, and Agile coaches will find this slide invaluable for communicating simultaneous project progress. PMO leads can use it for portfolio reviews, while marketing and IT teams may adopt it for campaign updates or software release tracking. Consultants and analysts can leverage these visual indicators to streamline stakeholder briefings and drive data-informed decision-making.
Other Uses
Repurpose this template for departmental dashboards, risk assessment overviews, or resource allocation reports. Adapt the circular badges to display KPIs such as budget burn-rate, customer satisfaction scores, or performance targets. Use the progress bars as timeline trackers for event planning or product roadmaps. The flexible structure also serves as a foundation for training progress charts, audit schedules, or fundraising milestone reports.
Login to download this file
Add to favorites
Add to collection

Item ID
SB02994