


Project Status Template for PowerPoint Dark

Description
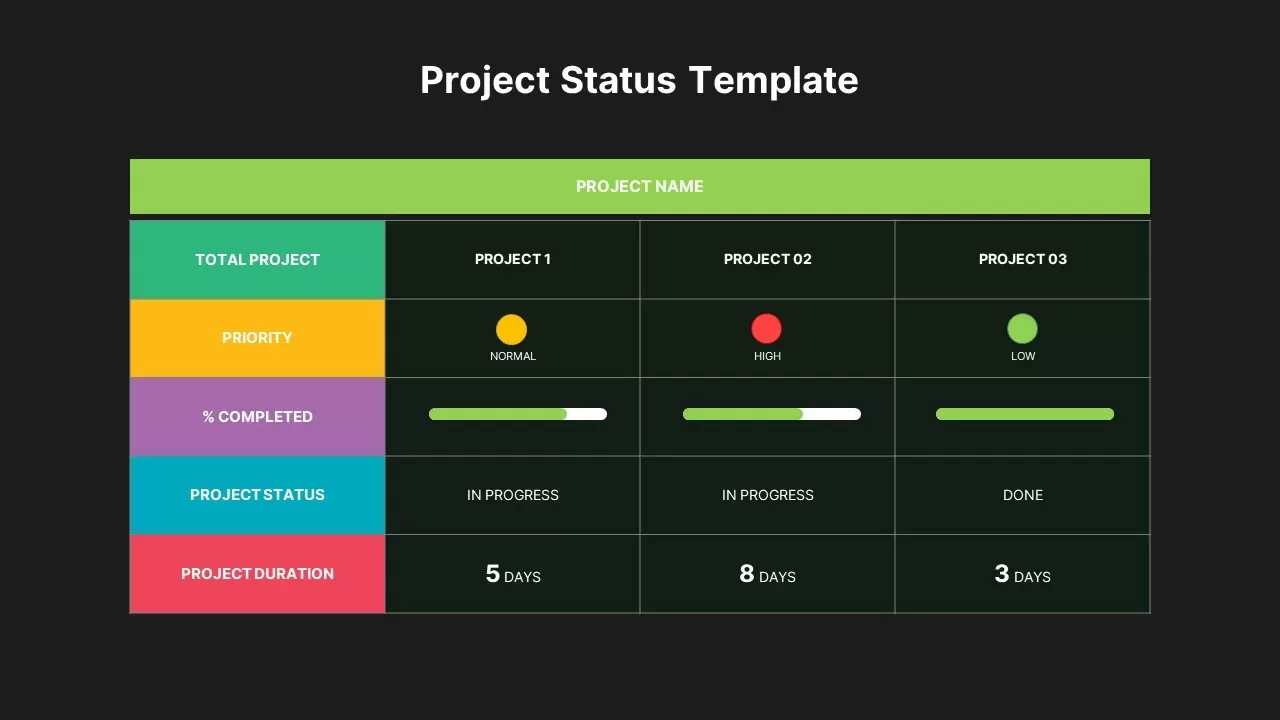
Showcase multiple project statuses at a glance using this Colorful Multi-Project Status Dashboard slide for PowerPoint & Google Slides. The slide begins with a bold, centered headline and a vibrant green project name banner that spans the full width, immediately tying the content to your project portfolio. Below, a structured table organizes five rows of critical metrics—Total Project, Priority, % Completed, Project Status, and Project Duration—across three project columns. Priority is visualized with colored circles (yellow for normal, red for high, green for low), while horizontal progress bars filled with accent hues track percentage completion against a contrasting neutral backdrop. Clear status labels (e.g., In Progress, Done) and numeric duration callouts in days provide concise, at-a-glance updates on each initiative’s lifecycle stage. A legend panel and optional icon placeholders further enhance interpretability.
Each table row is flagged by a distinct left-side accent bar—green, amber, purple, teal, and red—for immediate visual segmentation and ease of scanning. The clean white and pale mint cell fills maintain readability, while minimalist sans-serif typography reinforces a modern, professional aesthetic. Built on master slides with layered, fully editable vector elements, this template allows users to add or remove columns, rename projects, adjust color palettes to brand specs, replace icons, and modify progress bar lengths without manual alignment or reformatting effort.
Designed for real-time collaboration, this slide integrates seamlessly into executive briefings, sprint retrospectives, resource planning meetings, and stakeholder reports. Automatic table alignment guides and smart placeholders empower teams to update data quickly while preserving consistent styling across large decks. Optional shape-based animations let presenters reveal metrics row by row, maintaining audience focus and highlighting priority shifts. Fully compatible with PowerPoint widescreen and Google Slides’ cloud interface, this high-resolution layout ensures flawless on-screen presentation and printed handouts.
Whether you’re an agile coach monitoring sprint backlogs, a PMO steering concurrent programs, or a consultant delivering client reports, this Project Status Dashboard accelerates decision-making, promotes transparency, and keeps stakeholders aligned.
Who is it for
This slide suits project managers, program directors, and PMO teams tracking multiple concurrent initiatives. Agile coaches and operations leaders can visualize sprint progress and resource allocation. Consultants and business analysts will find the dashboard invaluable for client status reports, while executive leadership can leverage the clear metrics at executive briefings to make informed strategic decisions.
Other Uses
Beyond project status reporting, repurpose this slide for portfolio health overviews, quarterly review dashboards, or vendor performance tracking. Use the structured layout to present risk scorecards, budget expenditure summaries, or HR recruiting pipelines. The customizable color accents and table rows adapt seamlessly to any data-driven presentation.
Login to download this file

Item ID
SB02974