


burke litwin the perfomance and change model
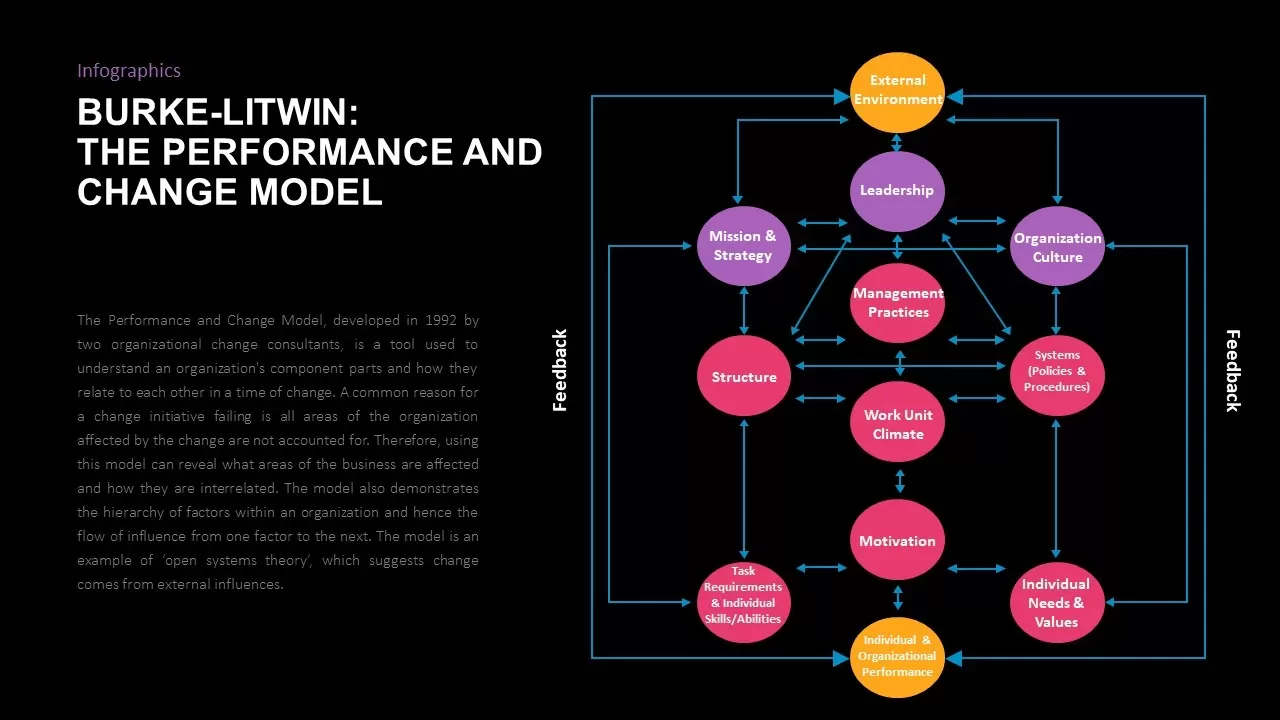
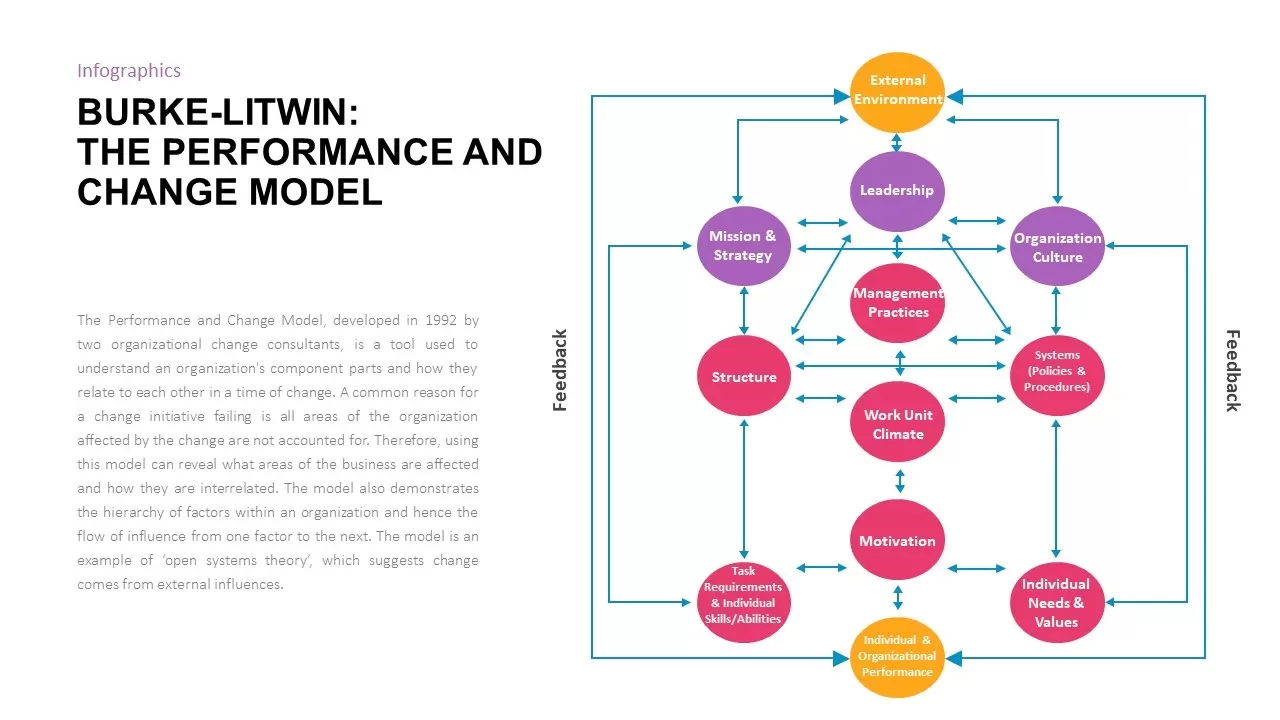
This Burke-Litwin Performance and Change Model infographic is designed to help visualize the interrelationship between various factors that affect organizational performance during periods of change. Developed in 1992, this model identifies key components like leadership, organizational culture, structure, and external environment, demonstrating how changes in one area can influence others. It’s an essential tool for understanding organizational dynamics and improving change management strategies.
The flowchart layout clearly illustrates the model's components and their feedback loops, offering a clear and engaging way to present complex theories on organizational performance and change. Each factor is color-coded for better visual clarity and can be customized to suit your organization’s specific focus areas or objectives. The diagram is a great way to present change management strategies, analyze organizational structures, or provide a detailed overview of how different organizational factors interact during change processes.
Who is it for
This slide is ideal for organizational development consultants, HR managers, change management professionals, and business leaders focused on driving effective change within their organizations. It’s also beneficial for trainers, coaches, and educators teaching organizational behavior or management theories.
Other Uses
In addition to its use in change management, this model can be adapted for presentations on leadership development, process improvement, organizational strategy, or system dynamics. It’s also useful for workshops or training sessions that focus on understanding organizational behavior or managing complex transitions.
Login to download this file

Item ID
SB02113