


Heat Map Template for Presentation Dark

Description
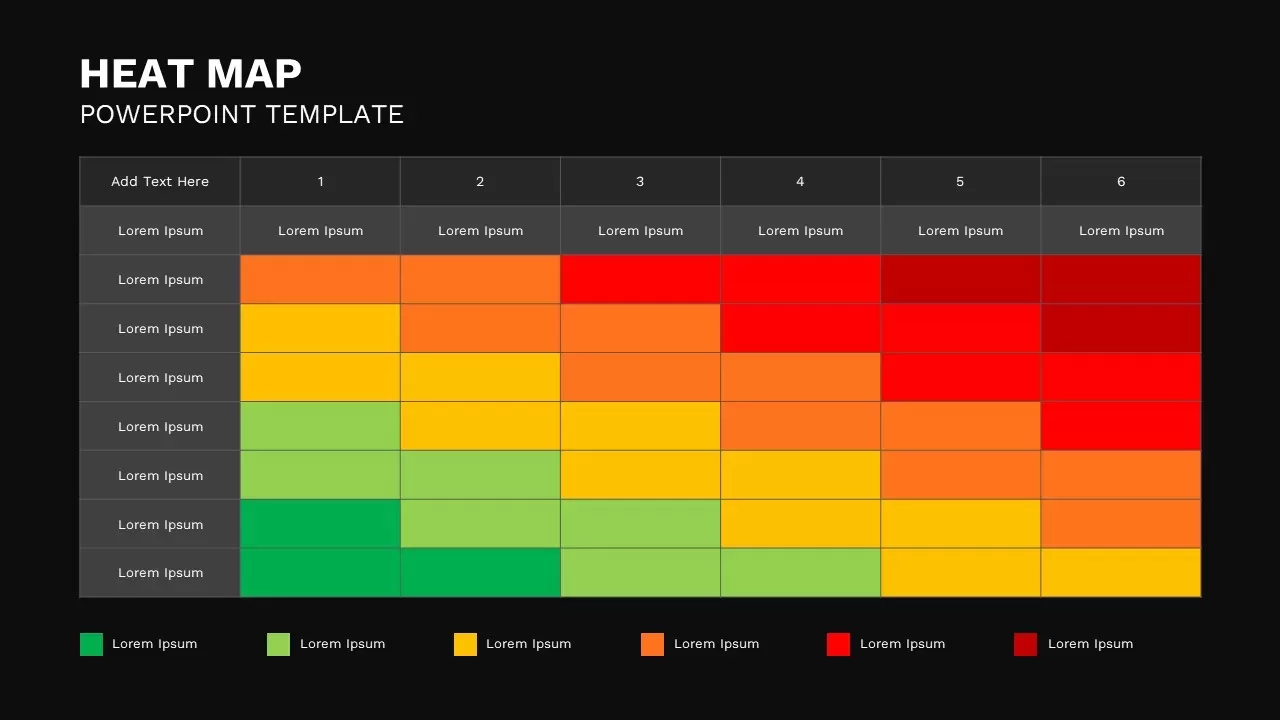
Leverage this interactive heat map matrix slide to present complex data distributions, risk assessments, or performance benchmarks with striking clarity. This template features a fully editable four-by-six grid on a clean white canvas, complete with customizable header labels and row descriptors. Each cell is color-coded from green through yellow and orange to red, enabling instant visual identification of low to high values. A matching legend at the bottom clarifies color meanings, while placeholder text areas let you annotate categories, metrics, or risk factors.
Built on master slides for PowerPoint and Google Slides, this design supports rapid customization—adjust cell colors, edit text, add or remove columns, and swap headers in seconds. The minimalistic layout preserves focus on your data, ensuring readability on projectors, laptops, and tablets. High-resolution chart elements and consistent typography maintain professional polish across any screen size. Use shape formatting to align with brand palettes or apply alternative color themes for specific scenarios.
Whether you’re mapping probability versus impact in risk management, visualizing sales performance across regions, or comparing survey results by category, this heat map matrix drives data-driven decision-making. Pair it with trend charts or dashboards for a comprehensive analysis deck. Its intuitive structure adapts to board presentations, stakeholder reviews, project kick-offs, and training sessions—transforming dense tables into engaging visuals that guide audience focus.
Who is it for
Risk managers, business analysts, project leads, and compliance officers will leverage this slide to prioritize mitigation efforts and communicate risk profiles. Marketing teams, operations managers, and data scientists can also use it to track performance metrics, customer feedback, or resource allocations.
Other Uses
Repurpose this matrix for competitive benchmarking, quality control assessments, inventory planning, or vendor evaluations. Modify the grid to illustrate opportunity heat maps, performance scorecards, or decision-making criteria across diverse business functions.
Login to download this file
Add to favorites
Add to collection

Item ID
SB02912