


Benchmarking Template Dark

Description
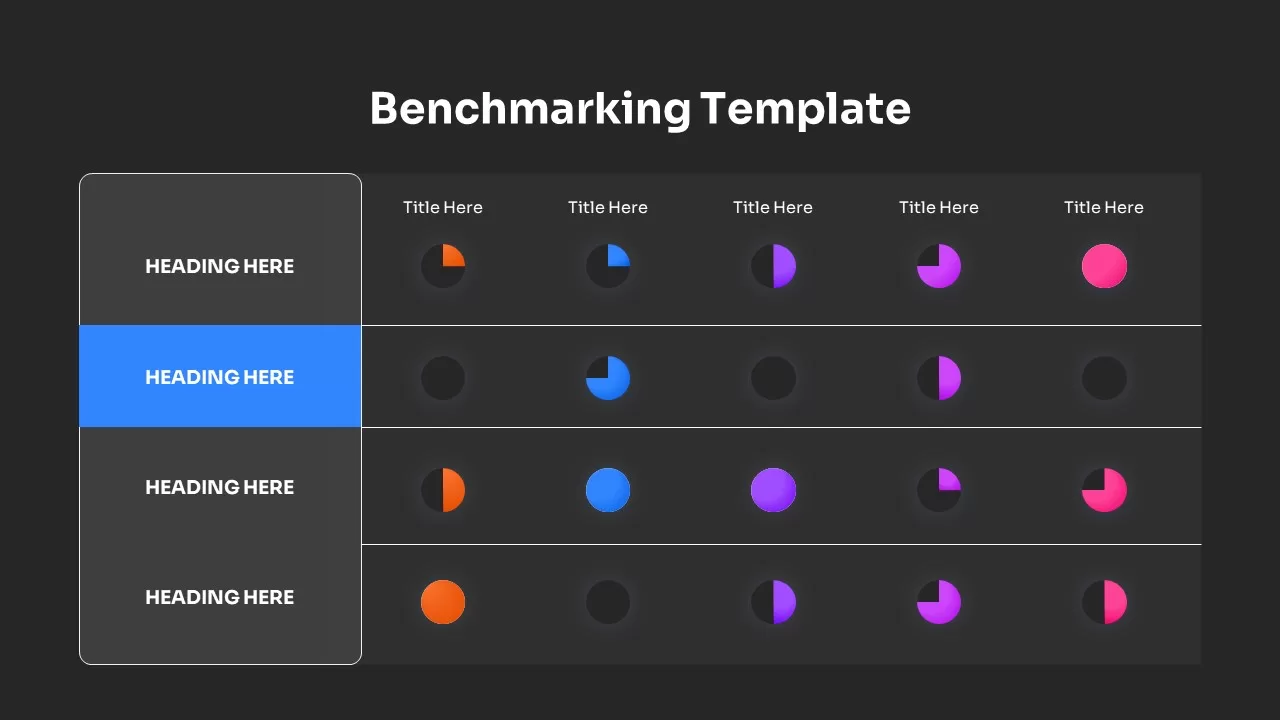
Leveraging a clean and structured table layout, this benchmarking slide template presents up to four distinct categories along the left axis, each paired with five customizable metric indicators across the top. Each cell features a minimalist circular pie-chart graphic—rendered in vibrant orange, blue, purple, and pink accents—set against a neutral white and soft gray background for optimal visual hierarchy. The second row is accentuated with a bold blue highlight bar, demonstrating how to call out a focused data subset. All chart elements are fully editable: adjust percentages, swap colors, update headings, and resize components with ease. Built on master slides with vector icons and intuitive placeholders, this asset ensures consistent formatting and seamless updates. Whether you’re comparing quarterly revenues, feature adoption rates, or competitor performance metrics, this slide simplifies complex data into an instantly interpretable overview. Designed for both PowerPoint & Google Slides, it maintains crisp resolution and streamlined styling across platforms.
The header area includes a prominent title placeholder at the top center, while the left panel supports descriptive row labels for quick category identification. Alternate row shading and subtle drop shadows add depth and improve readability, guiding audience attention toward key figures. Dedicated title text boxes above each chart offer context and allow for concise metric naming. With drag-and-drop functionality, you can replace pie icons with bar, donut, or gauge shapes to suit your data narrative. Utilize this slide to standardize benchmarking reports, streamline stakeholder presentations, and foster data-driven decision making.
Templates are optimized for both light and dark themes, and support global color changes via theme palettes. Responsive design ensures that graph proportions remain accurate when scaled, making this template a robust asset for annual reviews, strategic workshops, and executive dashboards.
Who is it for
Business analysts, product managers, performance marketers, and strategy consultants will benefit from this benchmarking slide when presenting comparative data, tracking KPIs, and aligning cross-functional teams.
Other Uses
Beyond competitive benchmarking, repurpose this layout as a KPI dashboard, scorecard overview, vendor evaluation matrix, RAG status report, or feature comparison table to suit diverse business needs.
Login to download this file

Item ID
SB02851