


Project Gantt Chart Template Dark

Description
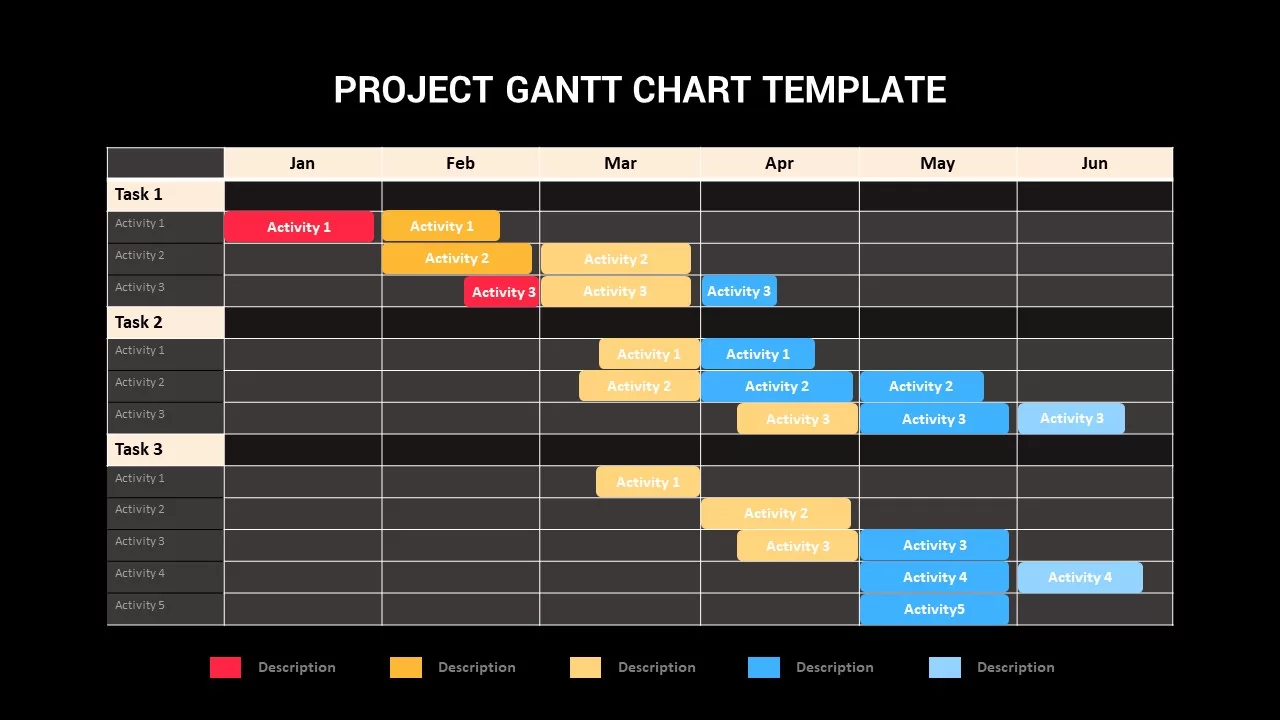
Visualize your project schedule with this fully editable Gantt chart timeline slide for PowerPoint & Google Slides. Tasks are organized into grouped rows with sub-activities, each represented by colored bars spanning monthly columns from January through June. A customizable legend at the bottom maps each color to activity types or priority levels, enabling teams to quickly interpret progress and dependencies. Subtle gridlines, ample white space, and rounded-corner bars ensure clarity at a glance, while slide masters and vector shapes let you adjust timeframes, add or remove tasks, and recolor bars in seconds.
Whether you’re planning product launches, managing marketing campaigns, or coordinating cross-functional initiatives, this template delivers a clean, professional aesthetic that adapts to any corporate or startup brand. Fully scalable vectors guarantee pixel-perfect clarity across devices, and built-in placeholders keep your chart consistent even as project scope changes. Use the timeline view to highlight critical milestones, identify potential scheduling conflicts, and drive data-driven discussions in status meetings or stakeholder briefings.
Who is it for
Project Managers, Program Leads, Scrum Masters, and PMO teams will benefit from this Gantt chart template when mapping deliverables, tracking progress, and communicating timelines. Marketing managers, event planners, and operations teams can also leverage this slide to coordinate complex workflows and align cross-departmental efforts.
Other Uses
Beyond traditional project planning, repurpose this timeline for product roadmaps, editorial calendars, training schedules, event planning, resource allocation charts, or any scenario requiring visual time-based tracking. Duplicate rows to compare multiple projects side by side or convert the chart into a milestone tracker by reducing bar lengths to icons.
Login to download this file
Add to favorites
Add to collection

Item ID
SB02838