3D Stacked Circle Infographics Powerpoint Keynote template

Description
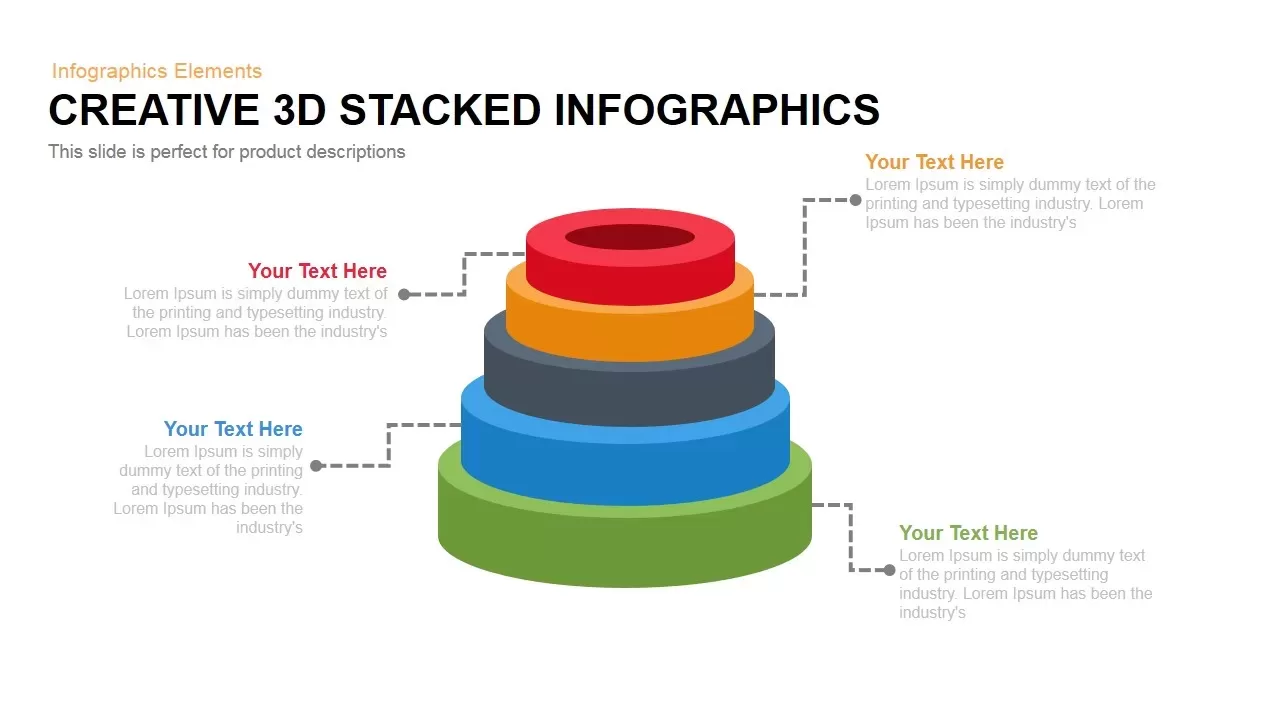
Leverage this dynamic 3D stacked infographic slide featuring five multicolored layers to illustrate hierarchical data or process stages with clarity and depth. At its core, a vector-based five-tiered cylinder stack uses gradient shading on green, blue, gray, orange, and red rings to depict progressive levels or priority segments. Four dotted-line callouts with colored headings and descriptive text placeholders connect to designated layers, enabling precise annotations for each tier. Subtle side arrows hint at carousel navigation, guiding viewers through each step in a sequential narrative.
Built on master slide functionality, this design offers seamless customization: adjust ring thickness, modify gradient stops, update callout text, or swap icons in seconds. The fully editable 3D shapes scale without loss of fidelity across PowerPoint and Google Slides, ensuring pixel-perfect visuals. A neutral white backdrop and minimalist typography maintain focus on data, while balanced white space and consistent alignment enhance readability.
Ideal for presenting business hierarchies, product roadmaps, or layered strategies, this template streamlines storytelling by visually stacking information in a logical order. Duplicate callouts or add extra tiers to accommodate additional segments, and rearrange color schemes to align with brand guidelines. The slide’s professional aesthetic and vector-based assets eliminate formatting issues and accelerate slide creation.
Whether mapping organizational structures, depicting service levels, or sharing step-by-step frameworks, this 3D stacked infographic empowers you to deliver complex concepts with impact and elegance. Use the callouts to highlight key insights, metrics, or milestones, and leverage the layered design to reinforce the relationship between different data points. Compatible across platforms, this asset ensures smooth collaboration and consistent rendering in any presentation environment.
Who is it for
Project managers, business analysts, marketing strategists, and product developers will leverage this 3D stacked infographic to illustrate hierarchical structures, layered roadmaps, or multi-phase strategies in boardroom presentations, stakeholder briefings, or workshop sessions.
Other Uses
Repurpose this slide for organizational frameworks, feature prioritization models, risk assessment hierarchies, or value proposition layers. Adjust layers and callouts to depict resource allocation, service tiers, compliance levels, or phased rollout plans across industries.
Login to download this file


