


powerpoint mix

Description
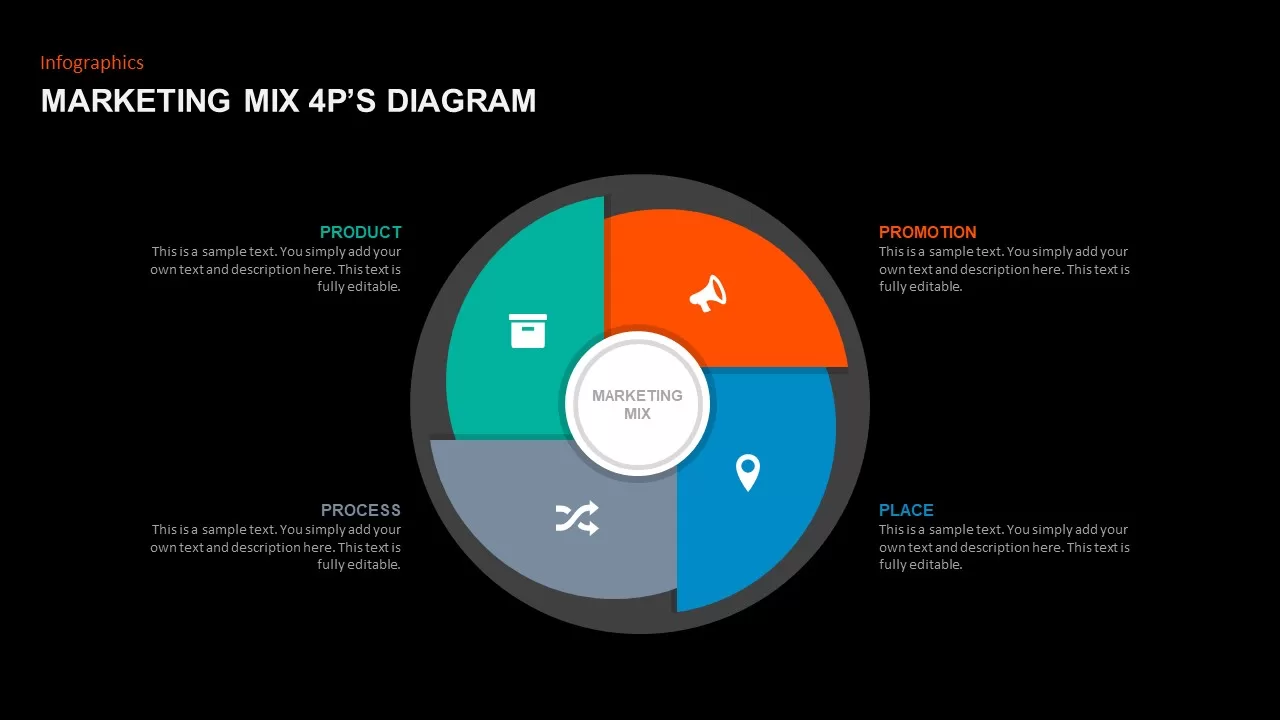
This Marketing Mix Infographic Presentation Template empowers marketing teams and consultants to visualize the classic 4Ps through 8Ps frameworks with clarity and style. You’ll find five fully editable master slides showcasing: a four-segment circular chart for 4Ps; a five-segment ring for 5Ps; a hexagonal honeycomb layout for 6Ps; a starburst diagram for 7Ps; and an eight-slice spiral for 8Ps. Each graphic uses vibrant gradients—teal, orange, blue, and slate—paired with crisp icons and placeholder text blocks for instant customization.
Built on smart guides and theme-color integration, this deck lets you swap colors, adjust segment proportions, and update labels in seconds without rebuilding shapes. Progressive animations reveal each segment or “P” one at a time, guiding audiences through product, price, place, promotion, people, process, physical evidence, and performance dimensions. Ample slide margins accommodate extended text, while consistent typography ensures a cohesive look across your deck.
Whether you’re delivering a university lecture, pitching a marketing plan, or training a sales team, these infographics accelerate ideation and decision-making. Duplicate slides to compare multiple scenarios side-by-side or export individual diagrams as standalone visuals for reports and white papers. Beyond marketing mix analysis, you can repurpose these layouts for service blueprints, customer journey maps, or departmental overviews—simply relabel icons and headings to fit any strategic framework.
Optimized for both PowerPoint and Google Slides, this template maintains full-resolution fidelity across devices and eliminates formatting headaches. Bring your marketing mix to life, drive alignment, and keep every stakeholder on the same page with this versatile infographic toolkit.
Who is it for
Marketing managers, brand strategists, consultants, educators, and startup founders seeking engaging visuals to present 4P–8P analyses in workshops, pitches, or training sessions.
Other Uses
Repurpose for service design frameworks, process overviews, project phase breakdowns, competitive analyses, or any context that benefits from segmented circular, honeycomb, starburst, or spiral infographics.
Login to download this file

Item ID
SB01643