


Current vs Future State PowerPoint Template Dark
Description
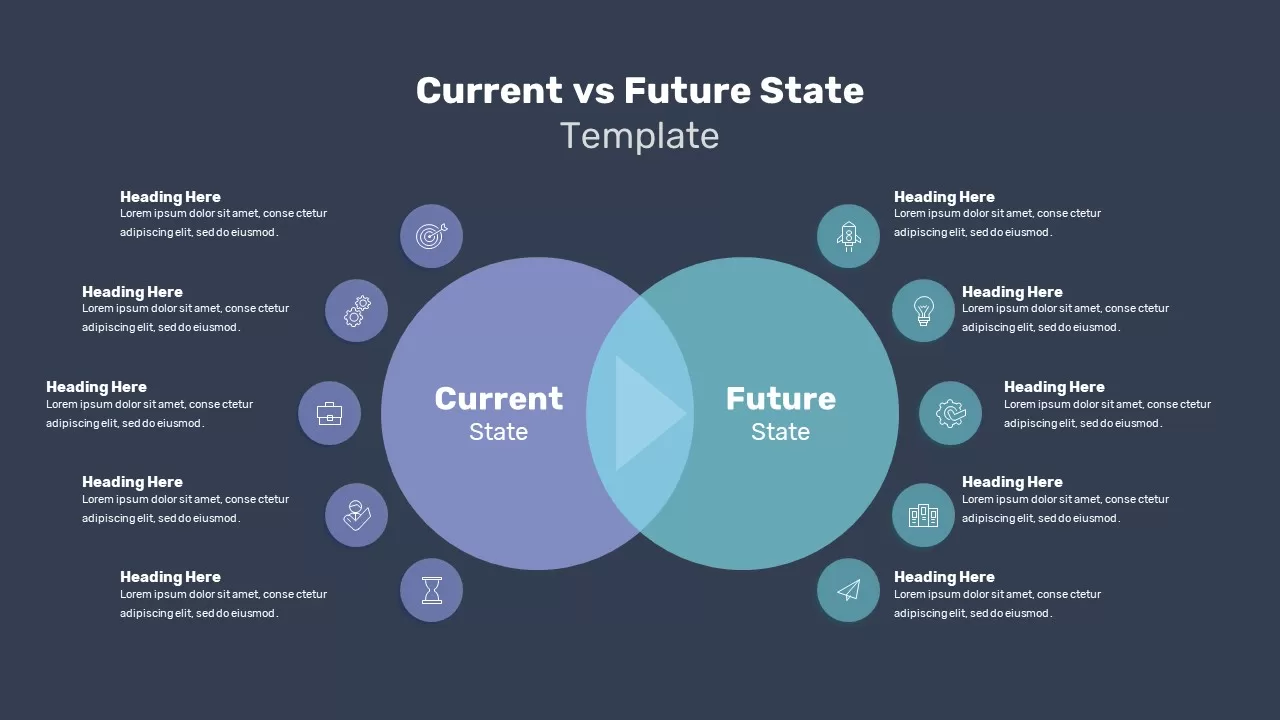
This slide features a two-part overlapping circle (Venn) diagram designed to compare current operations with desired future outcomes in a clear, intuitive format. The left circle is rendered in a soft purple tone, the right in a cool cyan hue, and their intersection subtly highlights shared elements. Around each perimeter sit ten evenly spaced icon callouts—five per side—linked by fine lines to concise text placeholders. A central raised circle anchors your core message, statistic, or logo, drawing immediate focus to the theme of transformation.
Set against a clean white background, the design uses subtle drop shadows and vector shapes to maintain crispness at any size. Connector lines extend from each icon to accompanying headings and body text in neutral gray, ensuring viewers effortlessly follow the comparison between “Current State” and “Future State.” The balanced layout and generous whitespace keep complex information digestible, making it ideal for data-driven storytelling.
Built on fully editable master slides for both PowerPoint and Google Slides, this template leverages gradient fills, snap-to-grid alignment, and predefined typography styles. You can instantly swap icons, update color palettes, adjust circle sizes, or reposition callouts without manual realignment. Hidden guides and optimized layers eliminate formatting errors and version-control headaches, while drag-and-drop functionality lets you refresh content in seconds.
Ideal for illustrating gap analyses, maturity assessments, or performance comparisons, this Venn diagram streamlines stakeholder workshops, executive briefings, and strategic planning sessions. Its modular design also supports quick adaptation—duplicate or hide callouts to emphasize specific metrics, annotate overlapping functions, or repurpose for SWOT intersections and process overlap analyses.
Who is it for
Business analysts, change leaders, and project managers who need to showcase current versus future capabilities. Perfect for executive presentations, transformation roadmaps, and organizational maturity workshops.
Other Uses
Repurpose this layout for Venn-style comparisons of customer segments, overlapping service offerings, or intersecting risk factors. Hide unused callouts to tailor the slide for three- or four-item comparisons, or swap the central circle for a KPI dashboard graphic.
Login to download this file

Item ID
SB02776