


Bubble Head Infographics Powerpoint Keynote template 1

Description
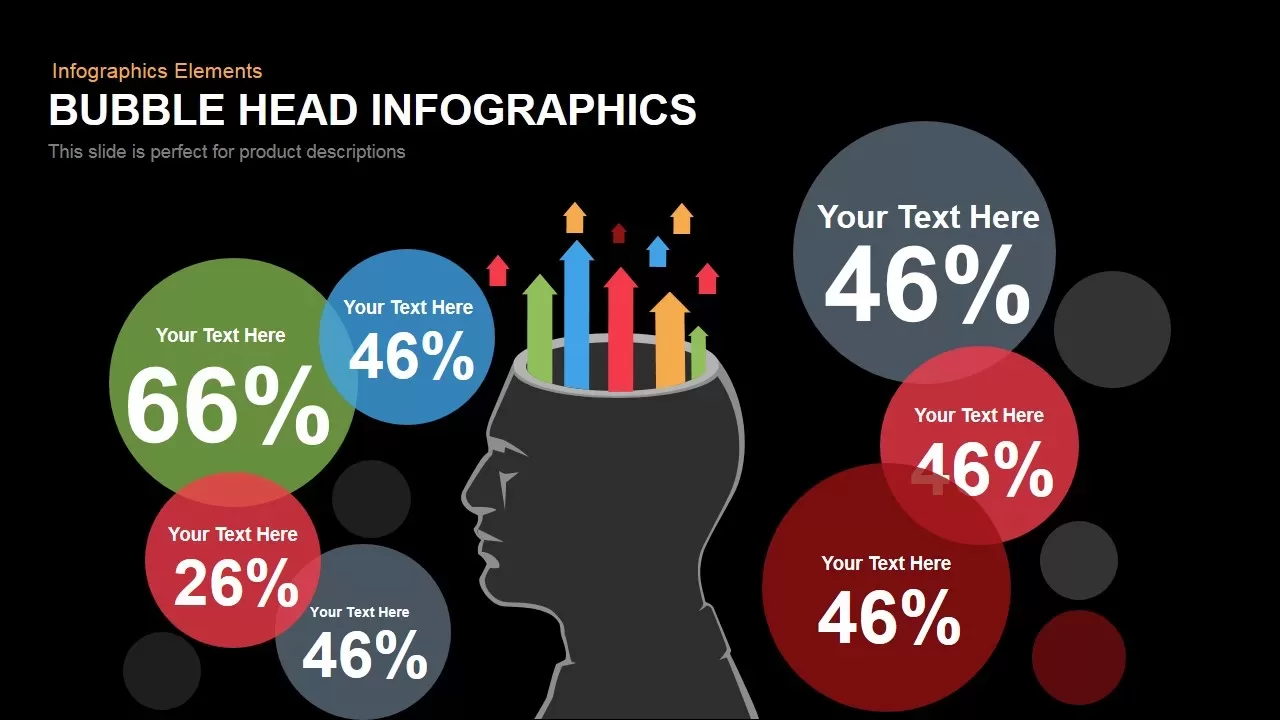
Harness the power of visual storytelling with this Bubble Head Metrics Infographic slide, featuring a central silhouette graphic topped with dynamic multicolored arrows representing emerging ideas. Surrounding the silhouette, six editable bubble shapes display percentage values and text placeholders, allowing you to highlight key statistics, survey results, or performance indicators. Each bubble uses a distinct accent color—green, blue, red, gray, and pink—against a clean white background, ensuring immediate data legibility and visual contrast.
Built on master slide functionality, this layout supports rapid customization: replace arrow colors, adjust bubble sizes, update percentage values, and edit text placeholders with just a few clicks. The vector-based head illustration and arrow graphics scale seamlessly across screen sizes, maintaining full-resolution clarity on both PowerPoint and Google Slides. Soft radial shapes and subtle gradient navigation arrows hint at an interactive carousel format, guiding viewers through a step-by-step narrative.
Ideal for marketing reports, project summaries, or thought leadership presentations, the infographic balances creative flair with functional design. The central-head motif serves as a metaphor for ideation, innovation, and cognitive processes, making this slide perfect for brainstorming outcomes, research insights, or cognitive performance metrics. Arrange bubbles around the head to map stakeholder feedback, consumer preferences, or experimental results in a cohesive, radial layout.
Leverage the intuitive placeholders to tailor the slide to your brand’s style guide, swapping icons or background shapes as needed. Whether showcasing user satisfaction ratings, product feature priorities, or training progress metrics, this bubble head infographic empowers you to present complex data in a memorable and engaging format. With seamless compatibility across platforms, you can deliver polished presentations that resonate with stakeholders and drive data-driven discussions.
Who is it for
Marketing managers, UX designers, product developers, and data analysts will find this bubble head infographic ideal for presenting survey data, user insights, or performance metrics in stakeholder meetings, workshops, or pitch decks.
Other Uses
Use this slide for brainstorming results, cognitive performance comparisons, audience segmentation, or idea prioritization workshops. Replace arrows or bubbles to showcase growth metrics, innovation milestones, or experimental findings.
Login to download this file
Add to favorites
Add to collection

Item ID
SB00115