


share market presentation

Description
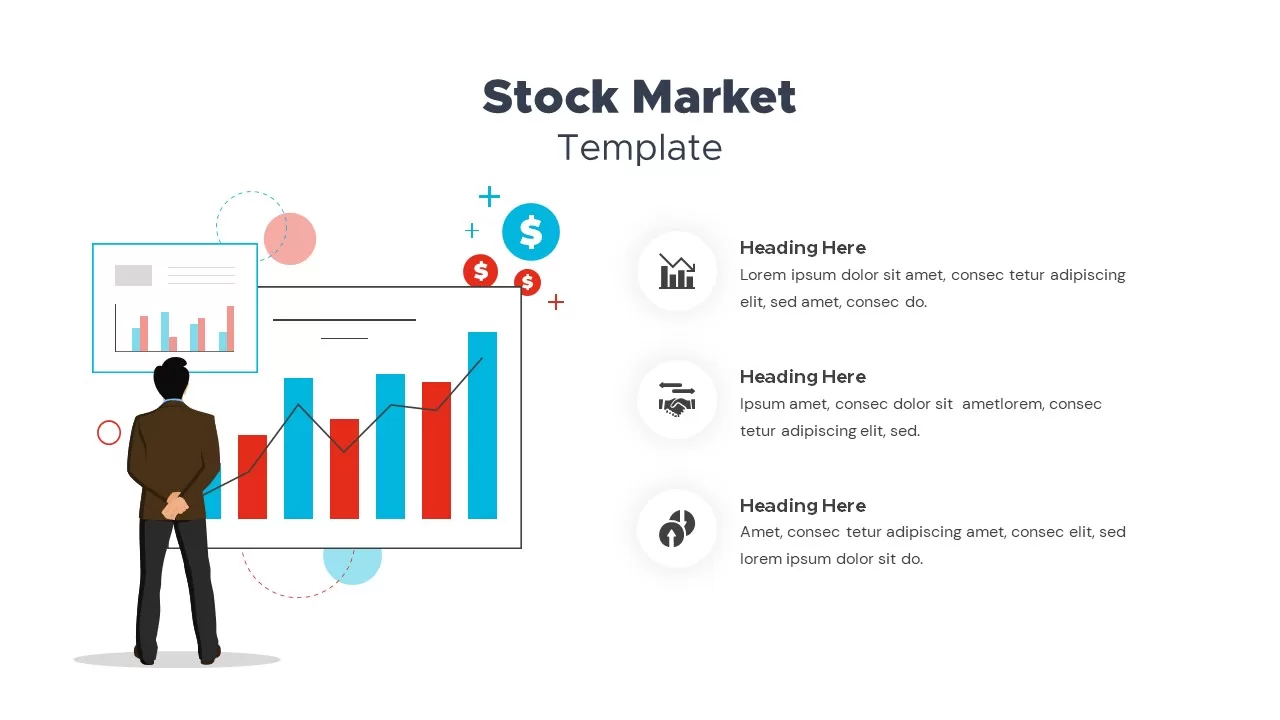
Leverage this dynamic Stock Market dashboard template to illustrate bullish and bearish trends with striking visual clarity. Featuring bold silhouettes of a charging bull and prowling bear in contrasting blue and red accents, this asset creates an immediate visual cue for market momentum. The template’s clean layout provides three distinct slide variations: an icon-driven feature list surrounding a central market overview, a direct bull vs. bear comparison slide with actionable bullet points, and an analytic chart slide complete with bar columns and line graphs. Each element is fully editable via master slides, allowing you to adjust colors, icons, and text placeholders with ease. Sharable across platforms, it ensures consistent styling from desktop to mobile. Highlight key metrics with the icon-based callouts—perfect for tracking KPIs, performance indicators, or strategic objectives. The flat design aesthetic, soft drop shadows, and crisp typography maintain a professional look that aligns with corporate branding standards. Whether you’re analyzing trend reversals, comparing market cycles, or preparing stakeholder briefings, this template streamlines your workflow. With vector-based graphics and scalable shapes, you can resize the bull and bear icons or chart elements without loss of quality. Customize data placeholders to display your quarterly earnings, revenue projections, or market share metrics. Leverage customizable color schemes to match your brand palette or focus on single-color emphasis. The presentation supports light and dark mode adjustments for different presentation environments. Embedded animation presets allow you to introduce each element dynamically, enhancing audience engagement. Optimized for both PowerPoint and Google Slides, it resolves compatibility issues and supports collaborative editing in real time—ideal for distributed teams and hybrid presentations.
Who is it for
Investment analysts, portfolio managers, and financial advisors will benefit from this dashboard when presenting market overviews, trend analyses, or quarterly performance reports. C-level executives and investor relations teams can leverage the bull vs. bear comparisons to align stakeholders on strategic decisions. Finance educators and MBA students can also use it to illustrate market dynamics in the classroom.
Other Uses
Repurpose this template for cryptocurrency trend reports, trading strategy workshops, or boardroom presentations on economic forecasts. Use the icon-driven slides to showcase KPIs, project financial roadmaps, or audit findings. The modular design also works for consulting proposals, market research summaries, and investor pitch decks.
Login to download this file

Item ID
SB02656