


Thermometer Infographics Dark
Description
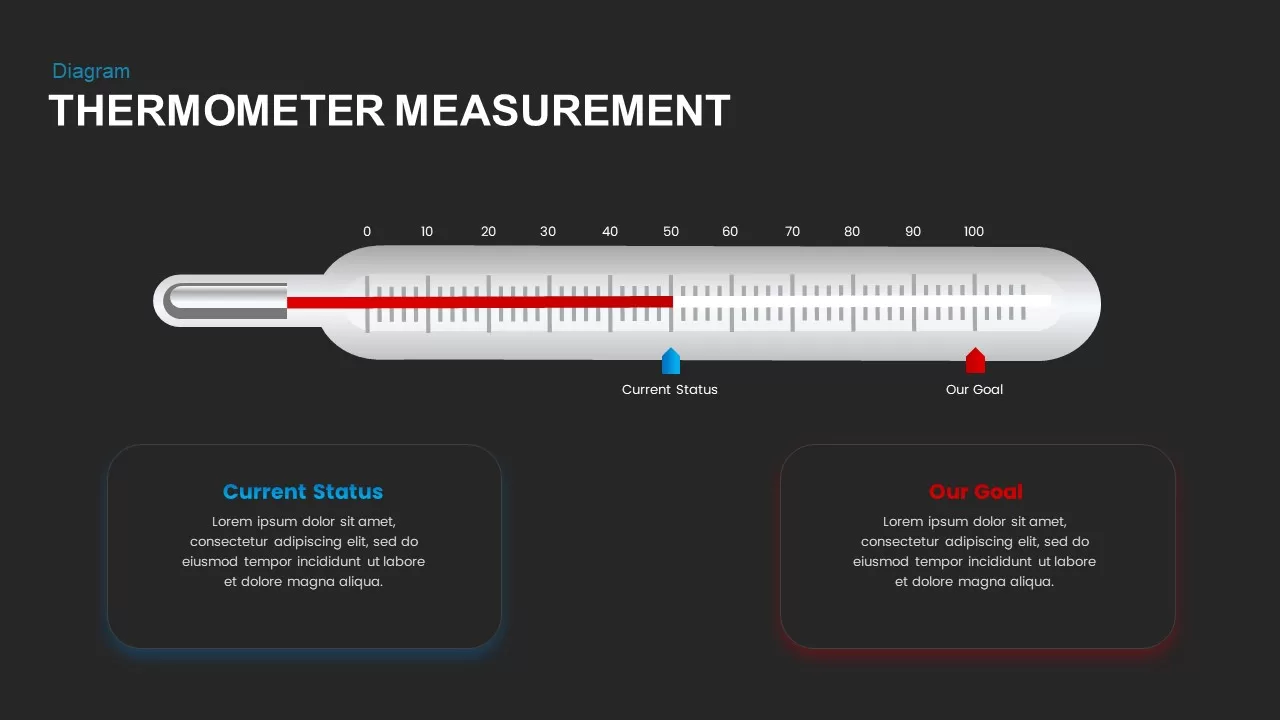
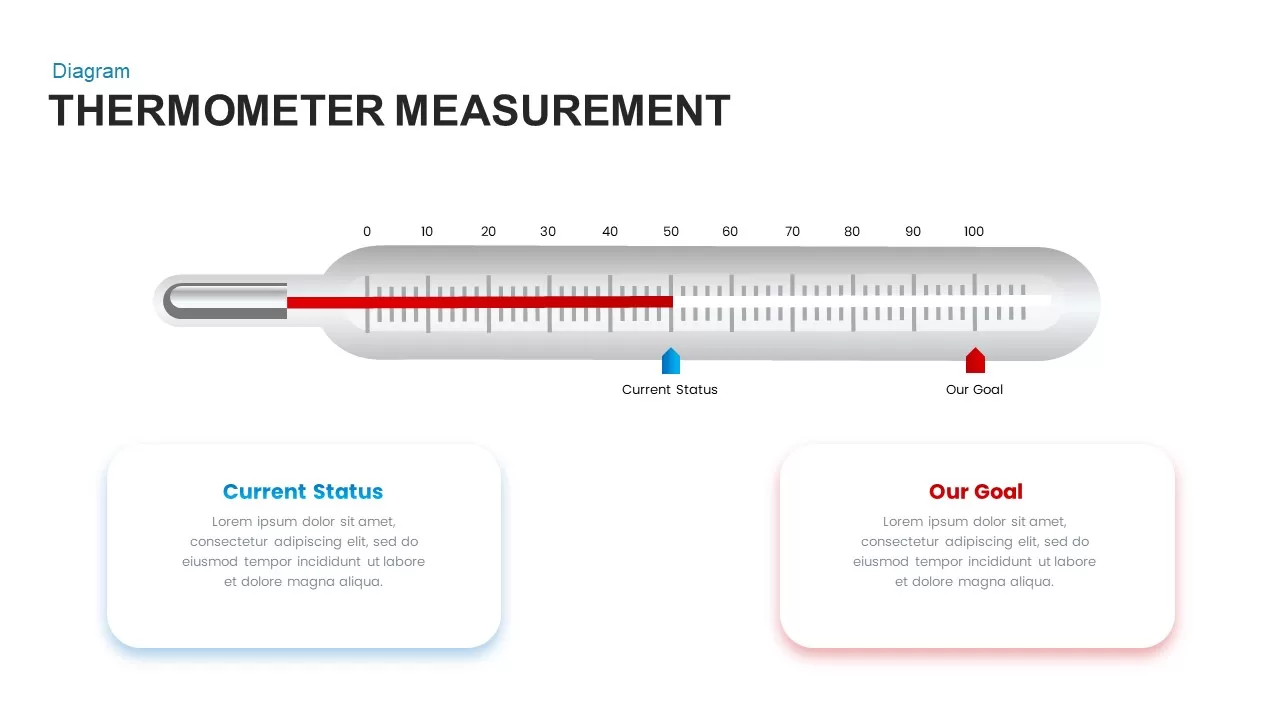
This Thermometer Gauge Progress Measurement slide delivers a visually intuitive meter graphic to showcase real-time performance against a predefined target. A horizontal thermometer stretches across the slide, calibrated from 0 to 100, with a vibrant red fill representing current progress. Two customizable arrow markers highlight the current status in blue and the goal in red, backed by descriptive text boxes for context. The polished gradient body, subtle shadowing, and clear scale ticks ensure your data stands out with clarity and impact.
Engineered for seamless editing in PowerPoint and Google Slides, this slide leverages master layouts and vector shapes to let you adjust colors, reposition markers, and update labels in seconds. Scale intervals, arrow styles, and text fonts are fully editable, making it easy to align with corporate branding or presentation themes. Automatically adapt the thermometer gradient or swap out icons, while preserving crisp resolution across devices and screen sizes. Whether you’re presenting to C-suite executives or frontline teams, readability and professionalism remain top priorities.
Ideal for tracking KPIs, project milestones, sales targets, or budget utilization, this thermometer diagram elevates stakeholder alignment by transforming raw numbers into a compelling visual story. Duplicate the slide to compare multiple metrics side by side, or integrate it into broader dashboards for continuous performance monitoring. Beyond business contexts, repurpose the design for health benchmarks, fundraising progress, educational objectives, or training program milestones. With its versatile layout and straightforward data mapping, you can drive data-driven discussions, motivate teams, and celebrate achievements at a glance. The fully scalable vector assets ensure flawless prints and high-resolution digital displays.
Who is it for
Project managers, sales directors, and performance analysts will benefit from this gauge slide to illustrate progress toward targets in stakeholder meetings or executive reviews. Marketing teams, finance officers, and HR professionals can also leverage the clear meter visualization to communicate campaign milestones, budget consumption, or training completion rates.
Other Uses
In addition to business reporting, use this thermometer graphic to track fitness goals, fundraising targets, academic progress, or event attendance milestones. The adaptable layout makes it easy to customize colors and labels for non-profit, educational, or personal development presentations.
Login to download this file

Item ID
SB02700