


Flow Chart Infographics for Presentation Dark
Description
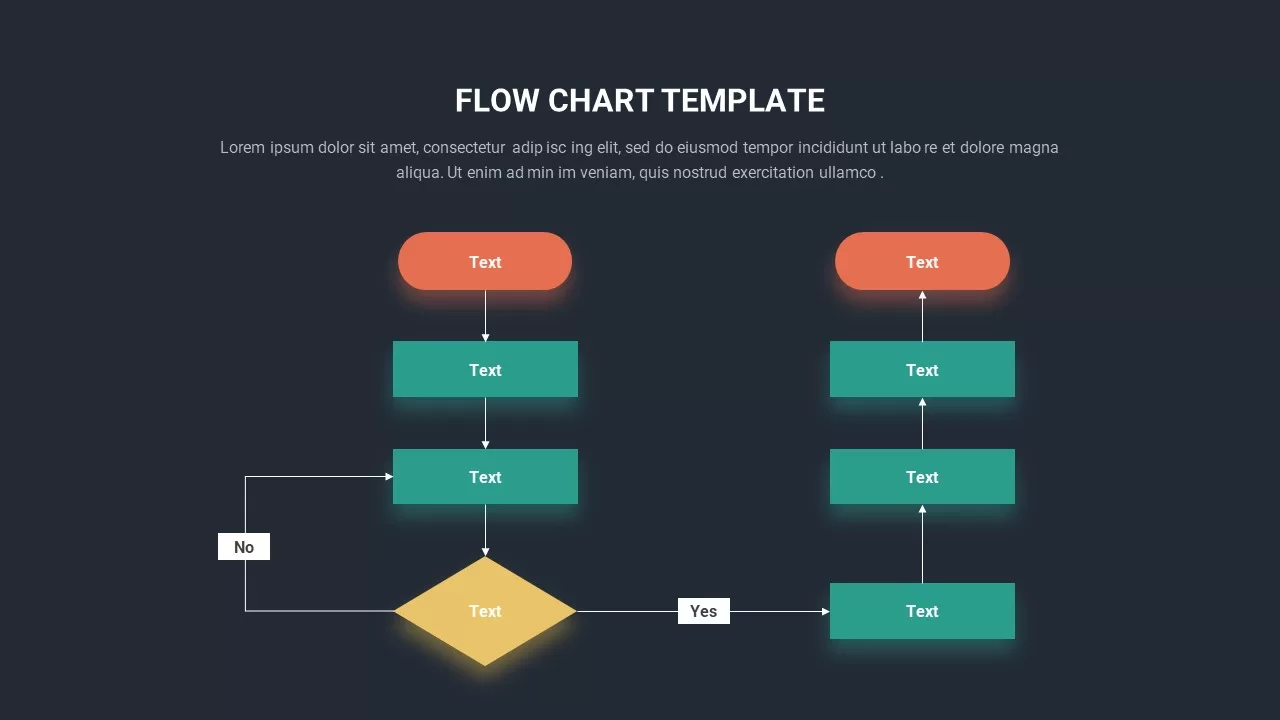
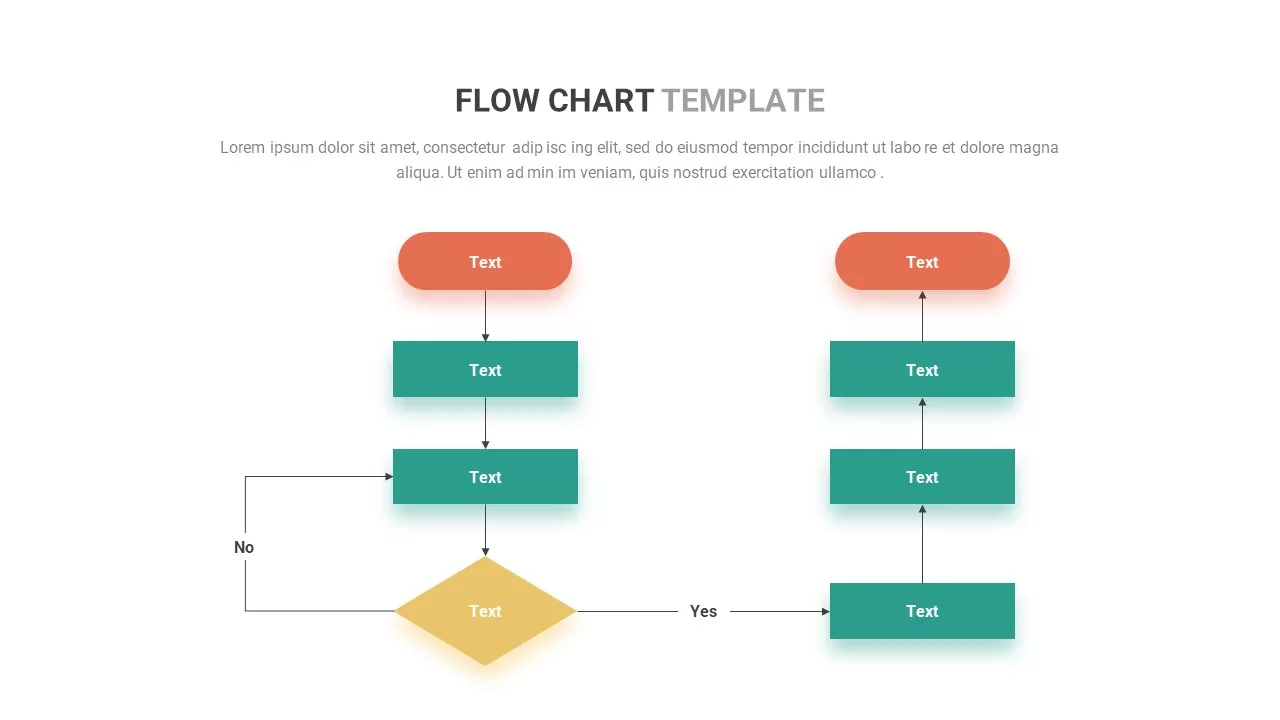
This Flow Chart template offers a clear and organized layout designed to visually represent a sequence of steps, decisions, or processes. With its distinct color-coded shapes, it provides a logical structure, making it easy for your audience to follow and understand any workflow or procedure. The orange, green, and yellow shapes in the chart stand out, providing a clean and professional look that is ideal for business, educational, or personal use.
The template includes several customizable placeholders for text, allowing you to insert your content and modify the flow chart to fit your needs. It’s perfect for illustrating complex processes, decision trees, or project workflows with ease. Additionally, you can customize the colors or icons within the flow chart to align with your brand or presentation theme. Optimized for use in both PowerPoint and Google Slides, this template ensures a smooth presentation experience across multiple platforms.
Who is it for
This template is ideal for project managers, business analysts, educators, or anyone looking to map out processes or workflows. It’s perfect for creating visual aids for presentations, proposals, or reports, whether you’re showcasing business processes, explaining workflows, or presenting step-by-step guides.
Other Uses
Beyond process mapping, the flow chart template can be adapted for decision trees, timelines, data flow diagrams, or even troubleshooting guides. Its flexible layout can be used in educational settings to explain concepts, in business environments to map out strategies, or in IT to depict system operations.
Login to download this file

Item ID
SB02633