


Flow Chart Infographics Dark

Description
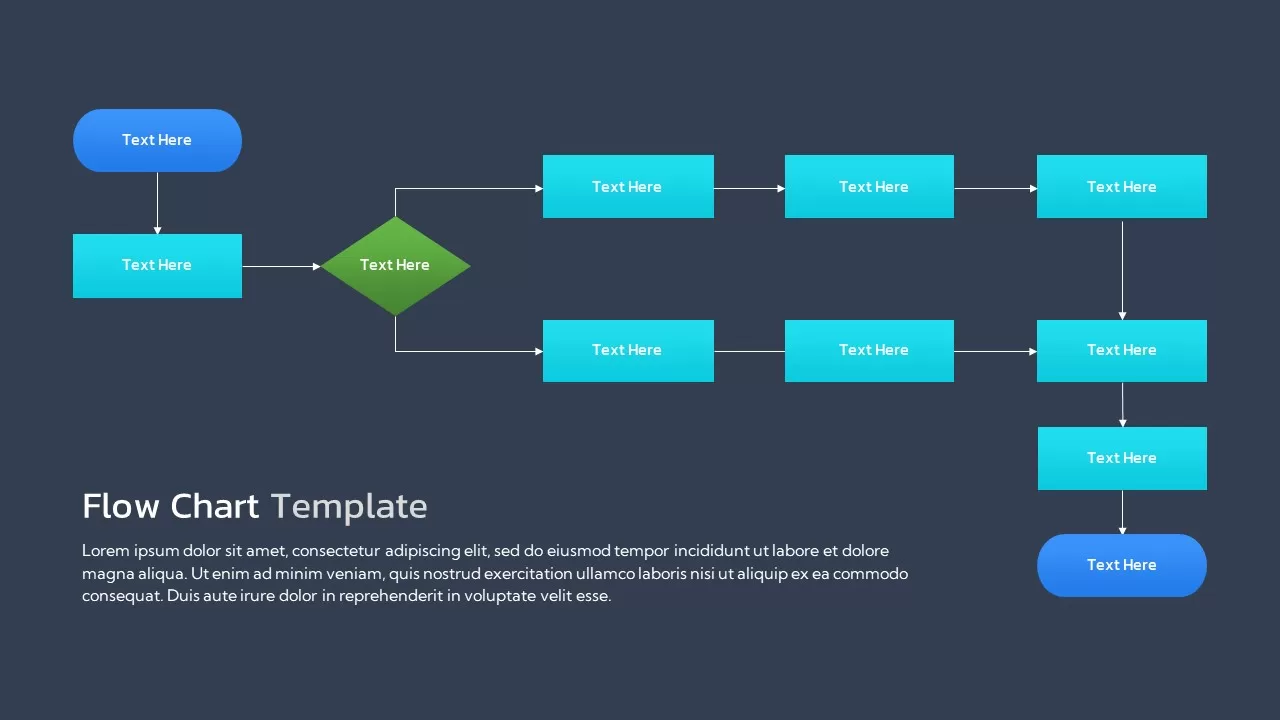
This Flow Chart Diagram slide offers a simple yet effective way to visually represent a process or workflow. The layout features connected boxes, each containing a customizable text placeholder, allowing for clear communication of step-by-step procedures. The flowchart includes various shapes—rectangles for process steps and a diamond for decision points—making it suitable for depicting decision-making processes, operations, or project workflows.
The color scheme is composed of blue and green shades, providing a professional and easy-to-follow aesthetic that maintains clarity and focus. Each shape is designed for easy customization, enabling you to adapt the content, colors, and layout to your needs. The clean, minimal design ensures that the flow is visually intuitive and that the audience can quickly understand the relationships between different process steps.
Optimized for both PowerPoint and Google Slides, this flowchart is ideal for project managers, business analysts, and anyone who needs to present a structured process, be it for a meeting, report, or workshop. It is fully editable, ensuring that you can update the chart according to your requirements with minimal effort.
Who is it for
Business analysts, project managers, and operations teams will benefit from using this flowchart to explain processes or workflows clearly. It’s also useful for training sessions or presentations that require a step-by-step breakdown of a project or procedure.
Other Uses
This slide can also be adapted for visualizing decision trees, project timelines, customer service workflows, or product development processes. It’s a versatile tool for any situation that involves sequential tasks or decision-making steps.
Login to download this file
Add to favorites
Add to collection

Item ID
SB02555