


Free Timeline Infographics Template Dark

Description
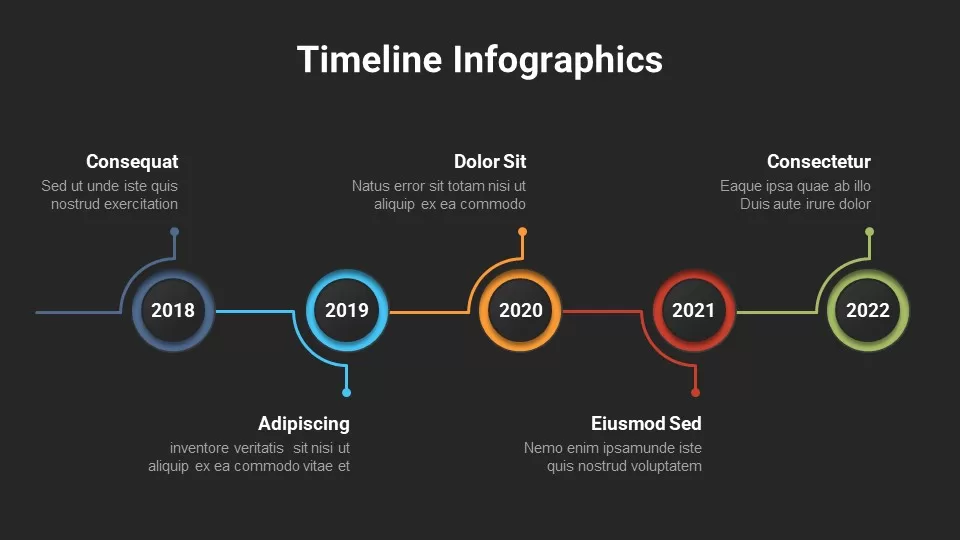
Leverage this five-point circular timeline infographic template to illustrate key milestones from 2018 through 2022 with clarity and visual impact. The slide features a continuous horizontal line punctuated by five circular year markers rendered in navy blue, light teal, orange, red, and olive green. Each marker includes a bold inner year label and an outer colored ring, while slender callout stems connect to editable text placeholders that can be positioned above or below the timeline. Minimalist icons above each callout reinforce conceptual themes, and subtle drop shadows lend depth without distracting from core content. The clean white background, consistent typography, and generous spacing create a modern, uncluttered aesthetic that draws focus to your milestones.
Built on fully editable master slides for both PowerPoint and Google Slides, this asset streamlines customization and branding. Swap icons or replace year labels in seconds, adjust ring colors to match corporate palettes, or reposition callouts and text boxes without manual alignment headaches. Vector-based graphics guarantee crisp output at any resolution, making this slide perfect for high-resolution displays or printed materials. Pre-set alignment guides and modular components ensure pixel-perfect layouts and seamless cross-platform performance, eliminating formatting issues during collaboration or file exchanges.
Whether you’re presenting product development roadmaps, marketing campaign phases, project milestones, or historical overviews, this timeline template supports rich storytelling with structured chronology. The balanced left-to-right flow guides audiences intuitively through each stage, making it ideal for executive briefings, investor pitches, team workshops, and academic lectures. Hidden placeholders accommodate additional annotations or numeric badges for KPI tracking, while duplicate callout lines can be added for deeper context. With this timeline in your toolkit, you can deliver professional-grade presentations that resonate across departments and industries.
Who is it for
Project managers, marketing strategists, data analysts, product teams, and executive leaders will benefit from this timeline when visualizing milestone progression, mapping project phases, or summarizing annual achievements. Educators, trainers, and consultants can also leverage the design for academic timelines, workshop agendas, or stakeholder presentations that demand clear chronological narratives.
Other Uses
Repurpose this circular timeline for sales forecasts, feature-release schedules, compliance roadmaps, or customer journey overviews. Use the callouts to display KPI highlights, resource allocation data, or risk-impact assessments. Duplicate the markers for quarterly timelines, regional rollouts, or multi-phase program tracking, ensuring consistent visual storytelling across internal and external communications.
Login to download this file
Add to favorites
Add to collection

Item ID
SB02539