


Flow Chart Powerpoint Keynote template 1
Description
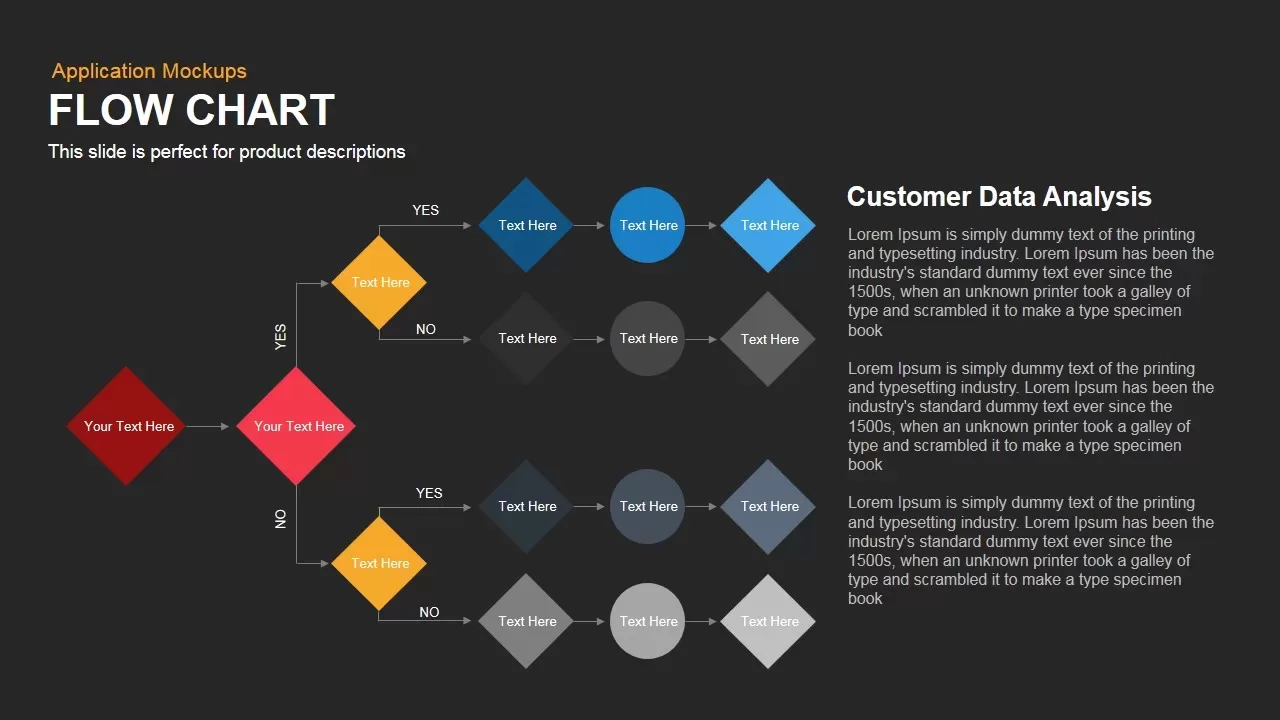
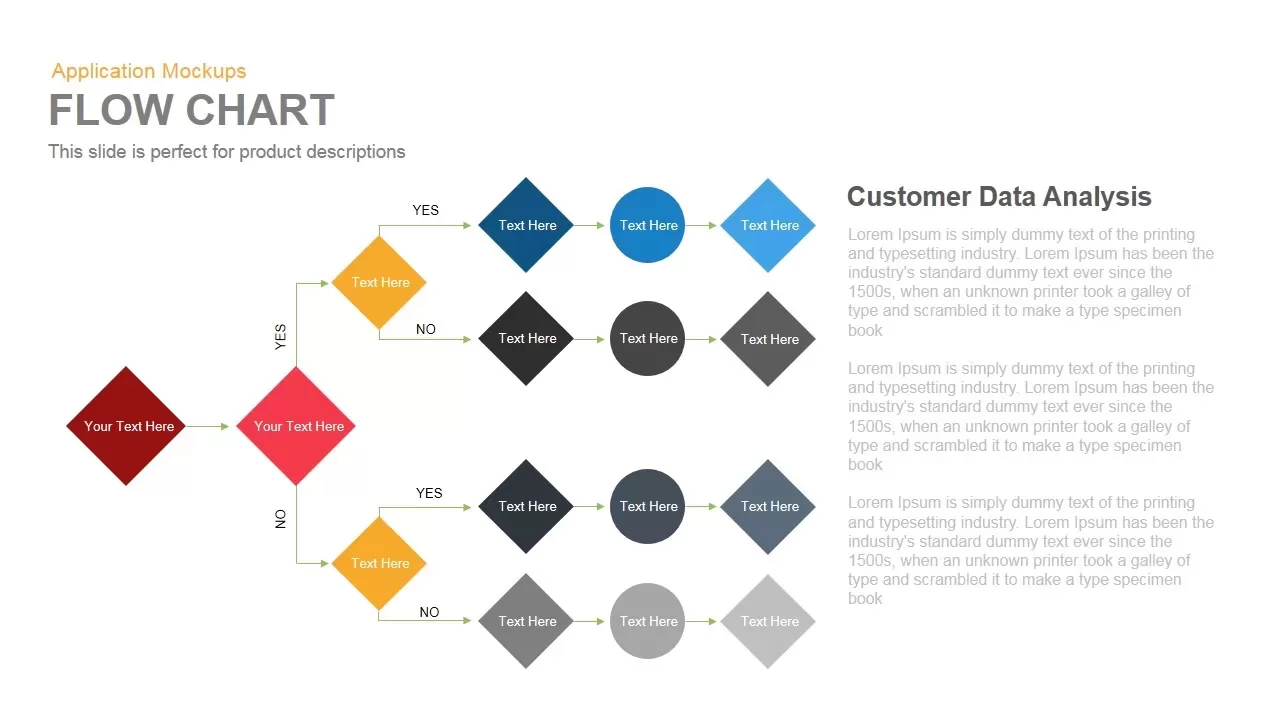
This Flow Chart template slide features a central branching diagram that maps decision points and outcomes with color-coded diamond and circle nodes. Starting with an overlapping pair of red decision diamonds, the flow splits into conditional branches labeled “Yes” or “No,” guiding audiences through alternate paths. Each branch continues through orange diamonds, blue circles, and gray diamonds, with connector arrows indicating process direction. On the right, a text block titled “Customer Data Analysis” provides space for a concise narrative or explanatory summary, with three paragraphs for detailed context. The design leverages vector shapes and dashed connectors to preserve clarity and visual hierarchy, ensuring that each decision node and outcome remains distinct. Master slide integration guarantees seamless resizing between widescreen (16:9) and standard (4:3) formats. All elements—including node shapes, colors, fonts, and labels—are fully editable in PowerPoint and Google Slides, allowing you to adapt the diagram to brand guidelines or thematic requirements. Simply insert your own criteria, outcomes, and explanatory text to produce a professional, high-impact flowchart that enhances narrative clarity and audience engagement.
Who is it for
Product managers, business analysts, strategy consultants, project managers, and UX designers will find this flow chart template ideal for mapping decision processes, illustrating conditional logic, or analyzing customer journeys in stakeholder presentations, training workshops, and strategy meetings.
Other Uses
Repurpose this layout to document troubleshooting flows, customer support scripts, quality assurance checks, compliance procedures, or internal audit processes. Easily adapt node labels and connectors to suit any decision-tree scenario or step-by-step operational guidelines across varied industries.
Login to download this file
Add to favorites
Add to collection

Item ID
SB00079